
Policy Memo
Topline
As the use of artificial intelligence continues to proliferate throughout society, affordable and reliable electricity is becoming increasingly central to U.S. economic growth and technological competitiveness.
Institute for Statistical Policy Analysis
As the use of artificial intelligence continues to proliferate throughout society, affordable and reliable electricity is becoming increasingly central to U.S. economic growth and technological competitiveness. In recent years, questions regarding electricity policy and data centers have received growing attention. Policymakers, however, are operating with remarkably limited information on this topic: no federal agency yet measures data center electricity use on a regular basis, forecasts have undergone substantial revisions, and many states do not disclose the fiscal cost of data center tax incentives. This paper examines these issues and the policy interventions proposed to address them, offering recommendations to foster abundant and reliable energy. These recommendations include a statutory basis for measuring data center load, public reporting of what state tax exemptions cost, permitting and interconnection reform, an all-of-the-above supply strategy, broader eligibility for consumer-regulated electricity, and rejection of data center moratoria. At the federal level, Congress should require the Energy Information Administration to collect data center load on Form EIA-861 and reform permitting and interconnection.
Data centers have rapidly become central in today’s national debate over artificial intelligence (AI). In federal and state governments alike, questions about generation capacity, grid reliability, and infrastructure costs permeate policy discussions. Lawmakers, utilities, and grid operators have considered a variety of tools to address these issues, yet the debate appears to be moving faster than the public data available to inform it. Fortunately, Congress has begun to take up these questions; a bipartisan permitting bill introduced in the Senate in September 2026, for example, would require the Energy Information Administration to collect data on data center load.1
Data centers are not new. Their origins stretch well back into the twentieth century, and they expanded significantly during the internet boom of the 1990s.2 Since the turn of the century, they have constituted the basis for streaming video, social media, and cloud computing, among others. By around 2005, data centers had begun to consume a nontrivial share of American electricity.3 Alongside the proliferation of artificial intelligence, electricity consumption is now increasing again, and unfortunately policymakers and utilities are making increasingly consequential decisions without a consistent public measure of the underlying load. What currently exists instead is a variety of estimates of questionable accuracy.4 Through an exploratory data analysis, we discuss these issues in this paper. We conclude with a series of policy recommendations regarding improving federal data collection and addressing unforeseen demand while protecting consumers in the process.
We begin with an overarching perspective of American electricity consumption and associated forecasts. Figure 1 plots total U.S. electricity end use from 1950 through 2025.5
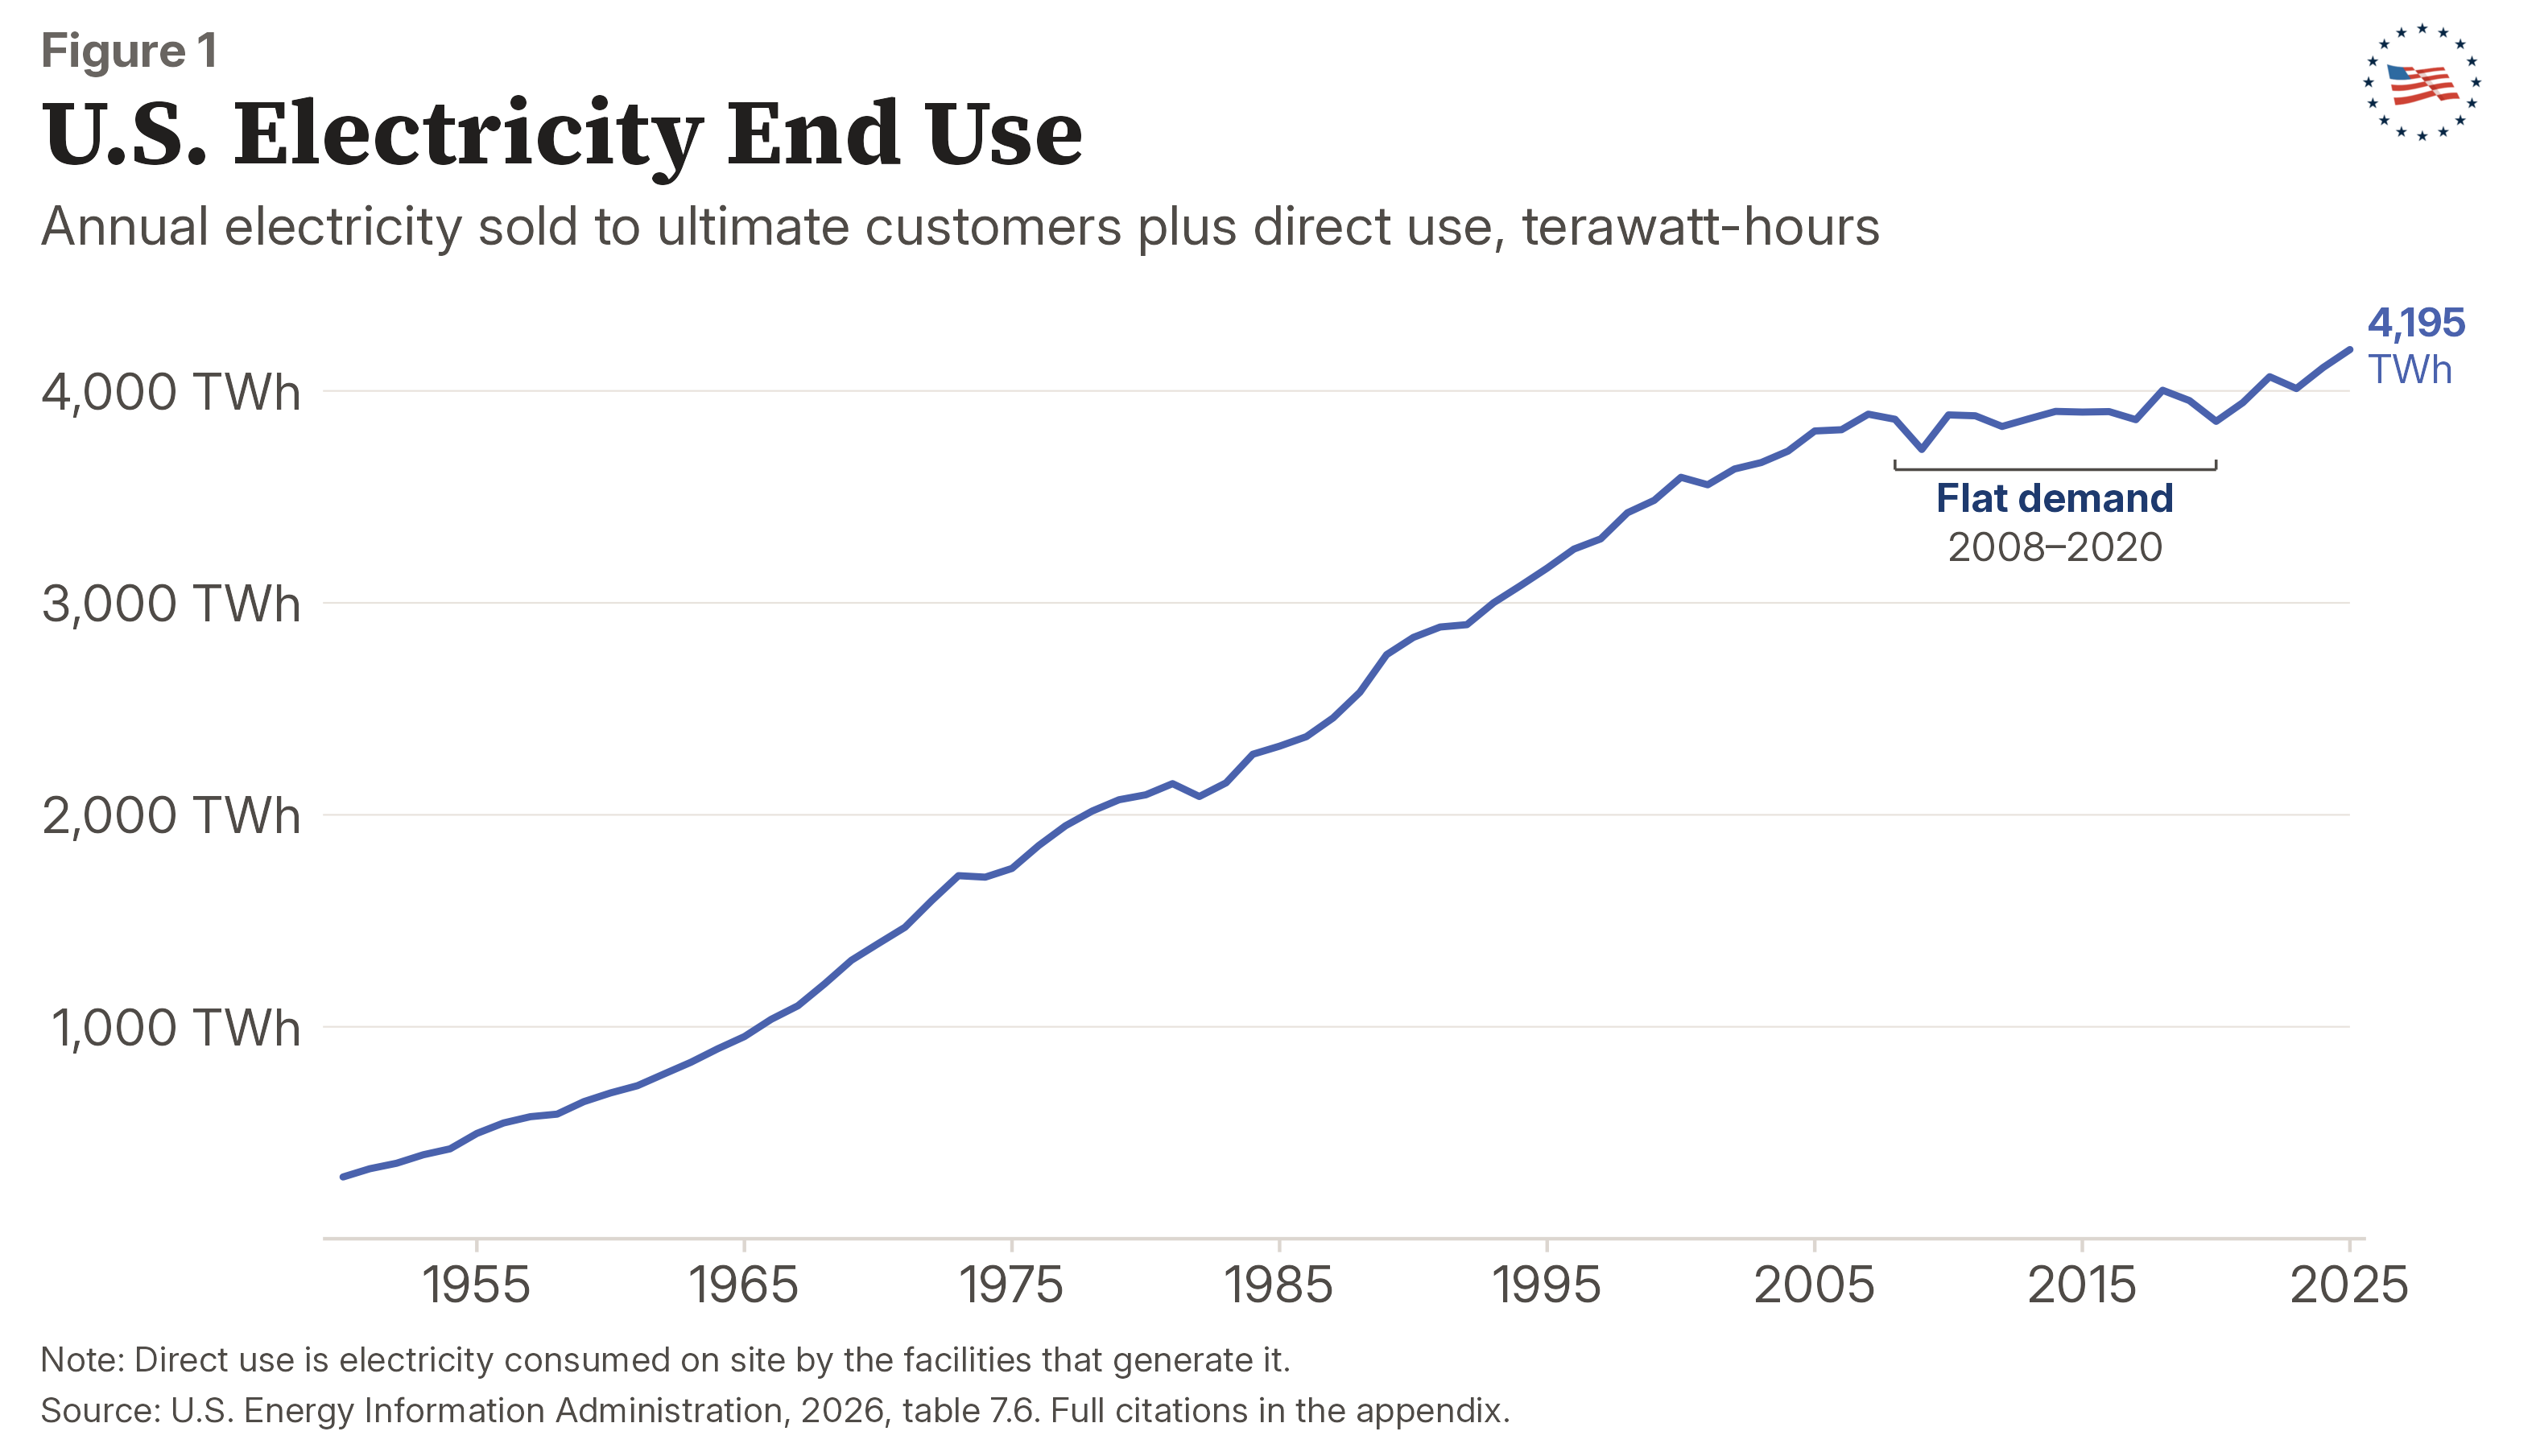
As Figure 1 shows, following World War II, electricity consumption grew more than sevenfold between 1950 and 1980 and nearly doubled again by 2008. These increases were driven heavily by a variety of factors, including air conditioning, increased urbanization, and the proliferation of computer technology. Subsequently, that growth plateaued as indicated by the shaded band. Since 2022, however, the series has turned upward. Consumption reached 4,195 terawatt-hours (TWh) in 2025, 3.2 percent above its 2022 level.
An interesting question is how much of this increase is attributable to data centers. There is no precise aggregate measure of how much electricity data centers consume. There have, however, been a variety of estimates, some of which are depicted in Figure 2.
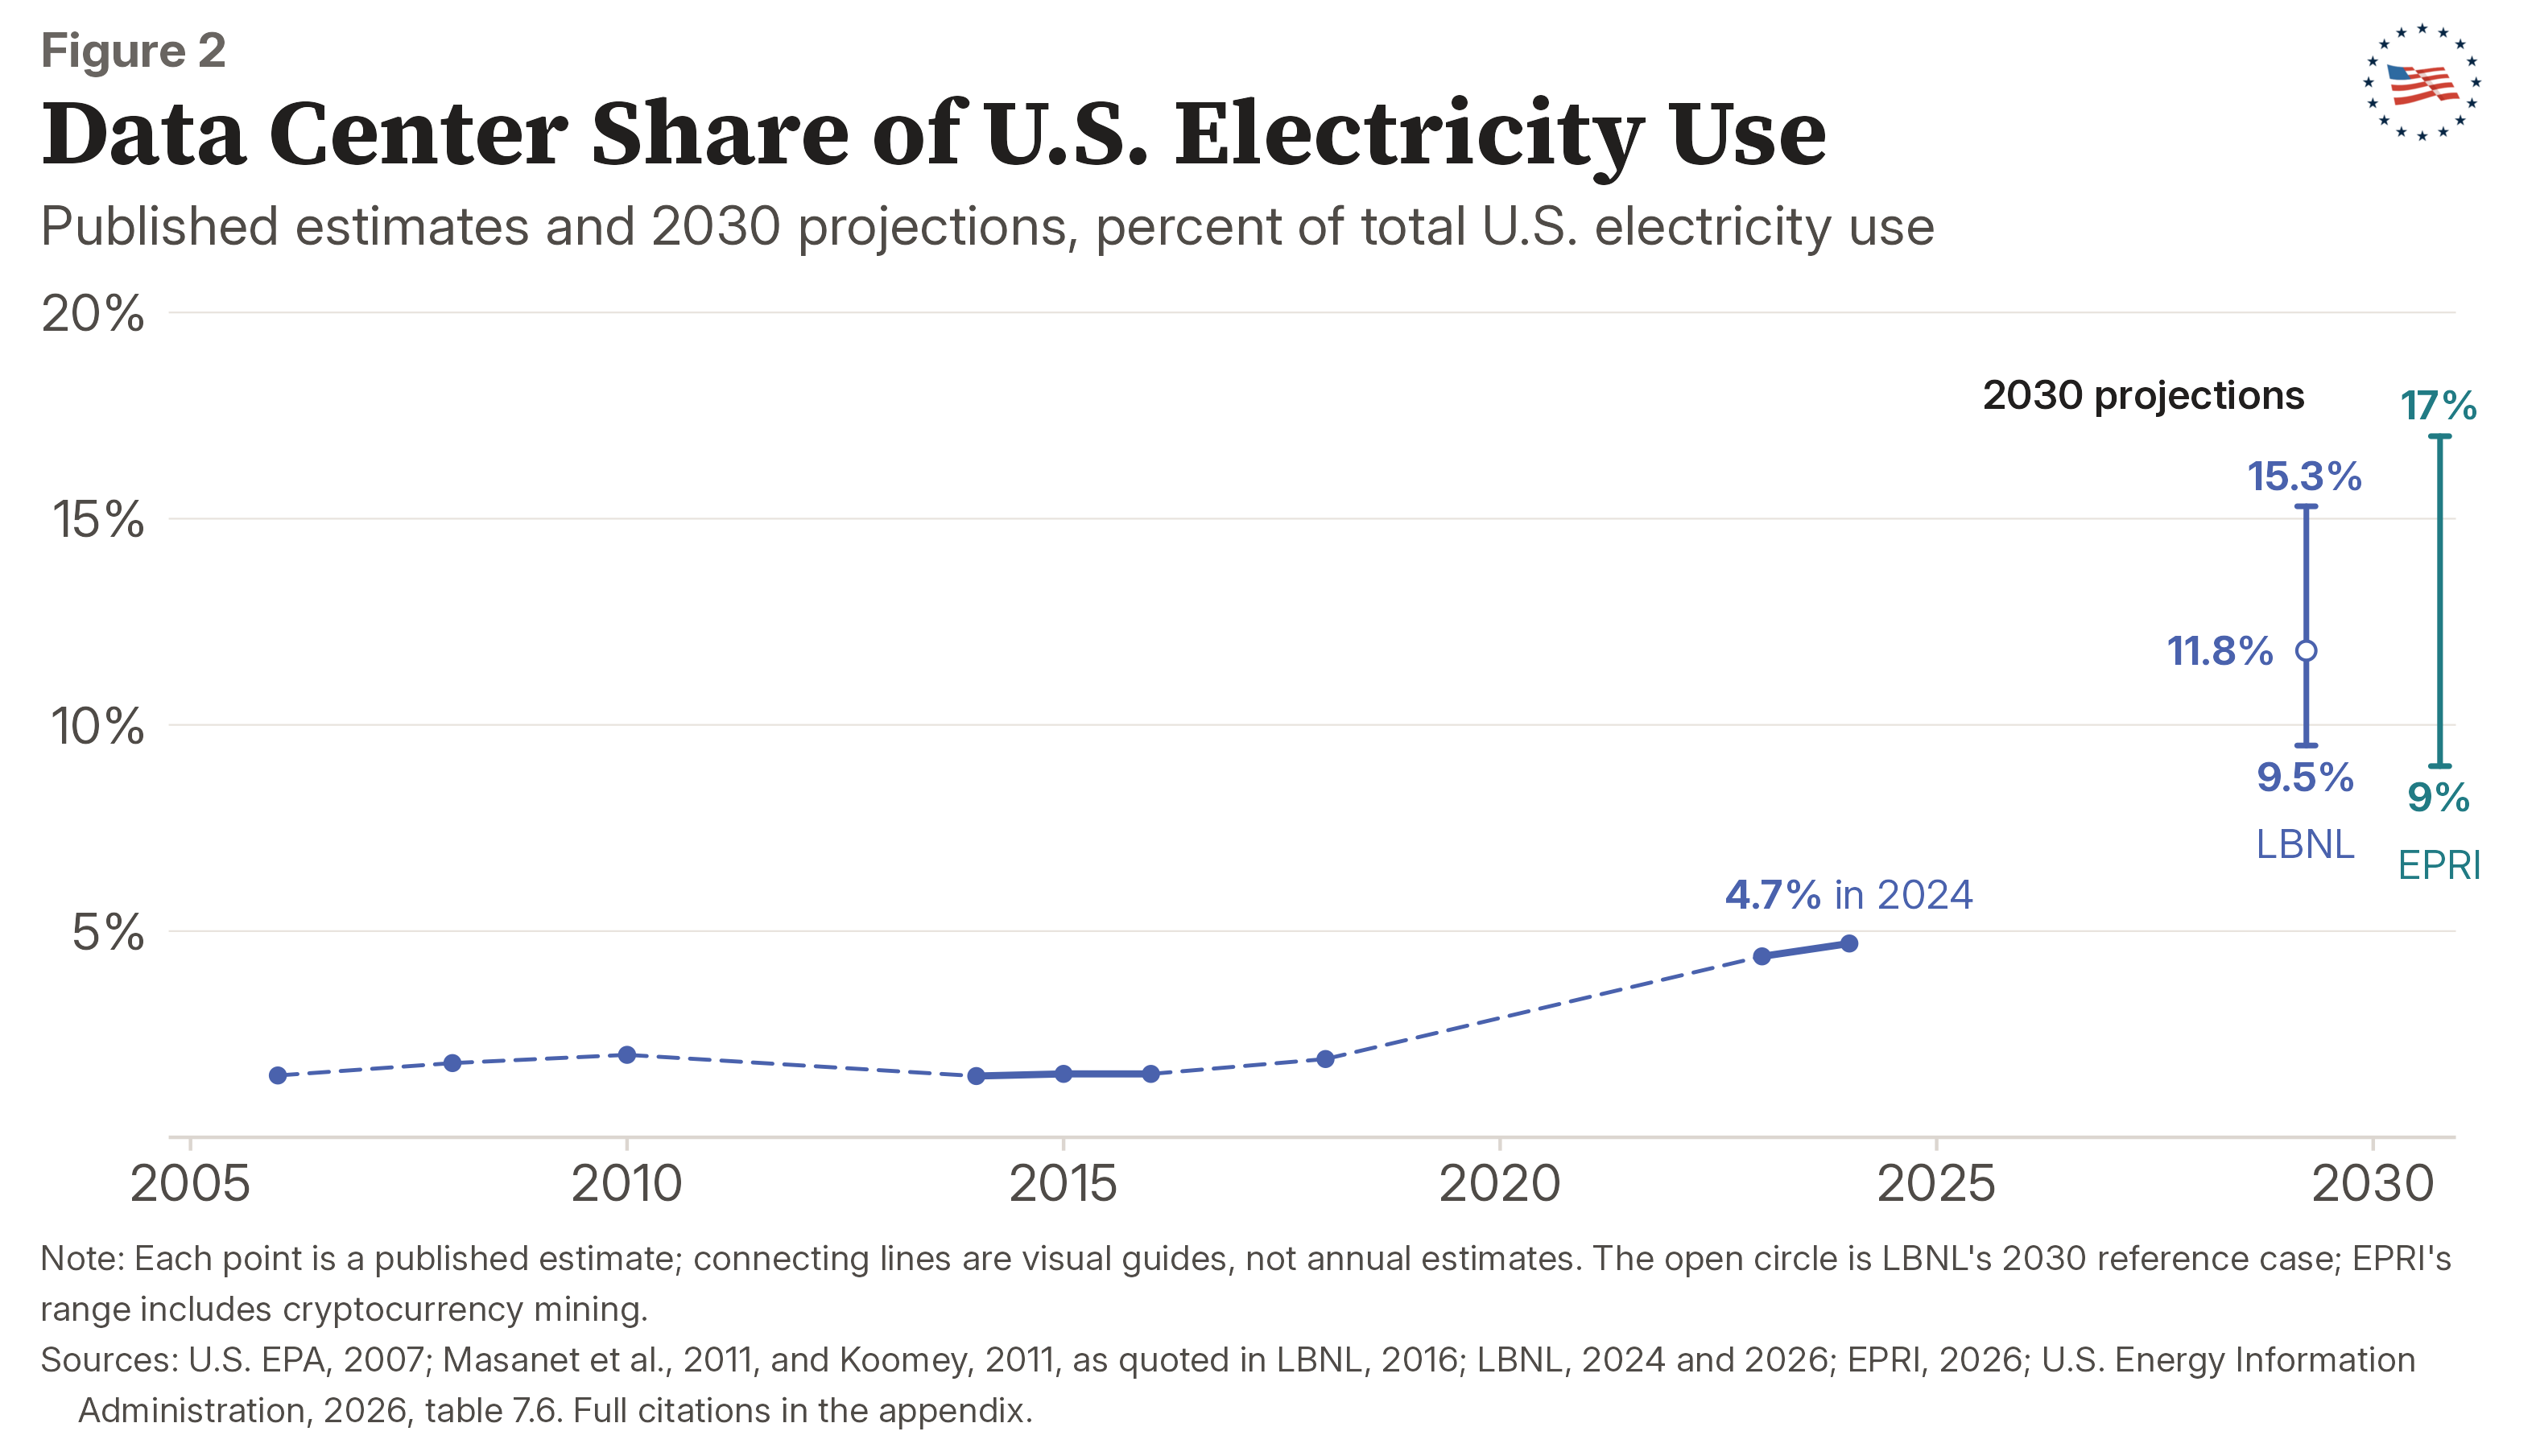
Each dot is an estimate from one of the sources referenced in the appendix; dashed lines interpolate between them. As Figure 2 shows, data centers were estimated to account for less than 5 percent of U.S. electricity through 2024.6 Projections for 2030, however, vary significantly, ranging from 9 to 17 percent of overall electricity consumption, based on projections from Lawrence Berkeley National Laboratory and the Electric Power Research Institute.7
Compounding these uncertainties, statistics on data center electricity consumption have never been collected comprehensively or consistently.8 We return to this issue at the end of the paper and offer a policy recommendation that the federal government could implement to improve the quality and consistency of these data.
Before returning to that recommendation, however, it is useful to understand how data center electricity consumption has changed across states in recent years. As such data are scant, the best we can do is analyze data across all customer classes that contain data centers. Figure 3 shows growth in electricity sales by state between 2019 and 2025 for all 50 states and the District of Columbia, on two measures9: commercial consumption alone, and commercial and industrial consumption combined.10
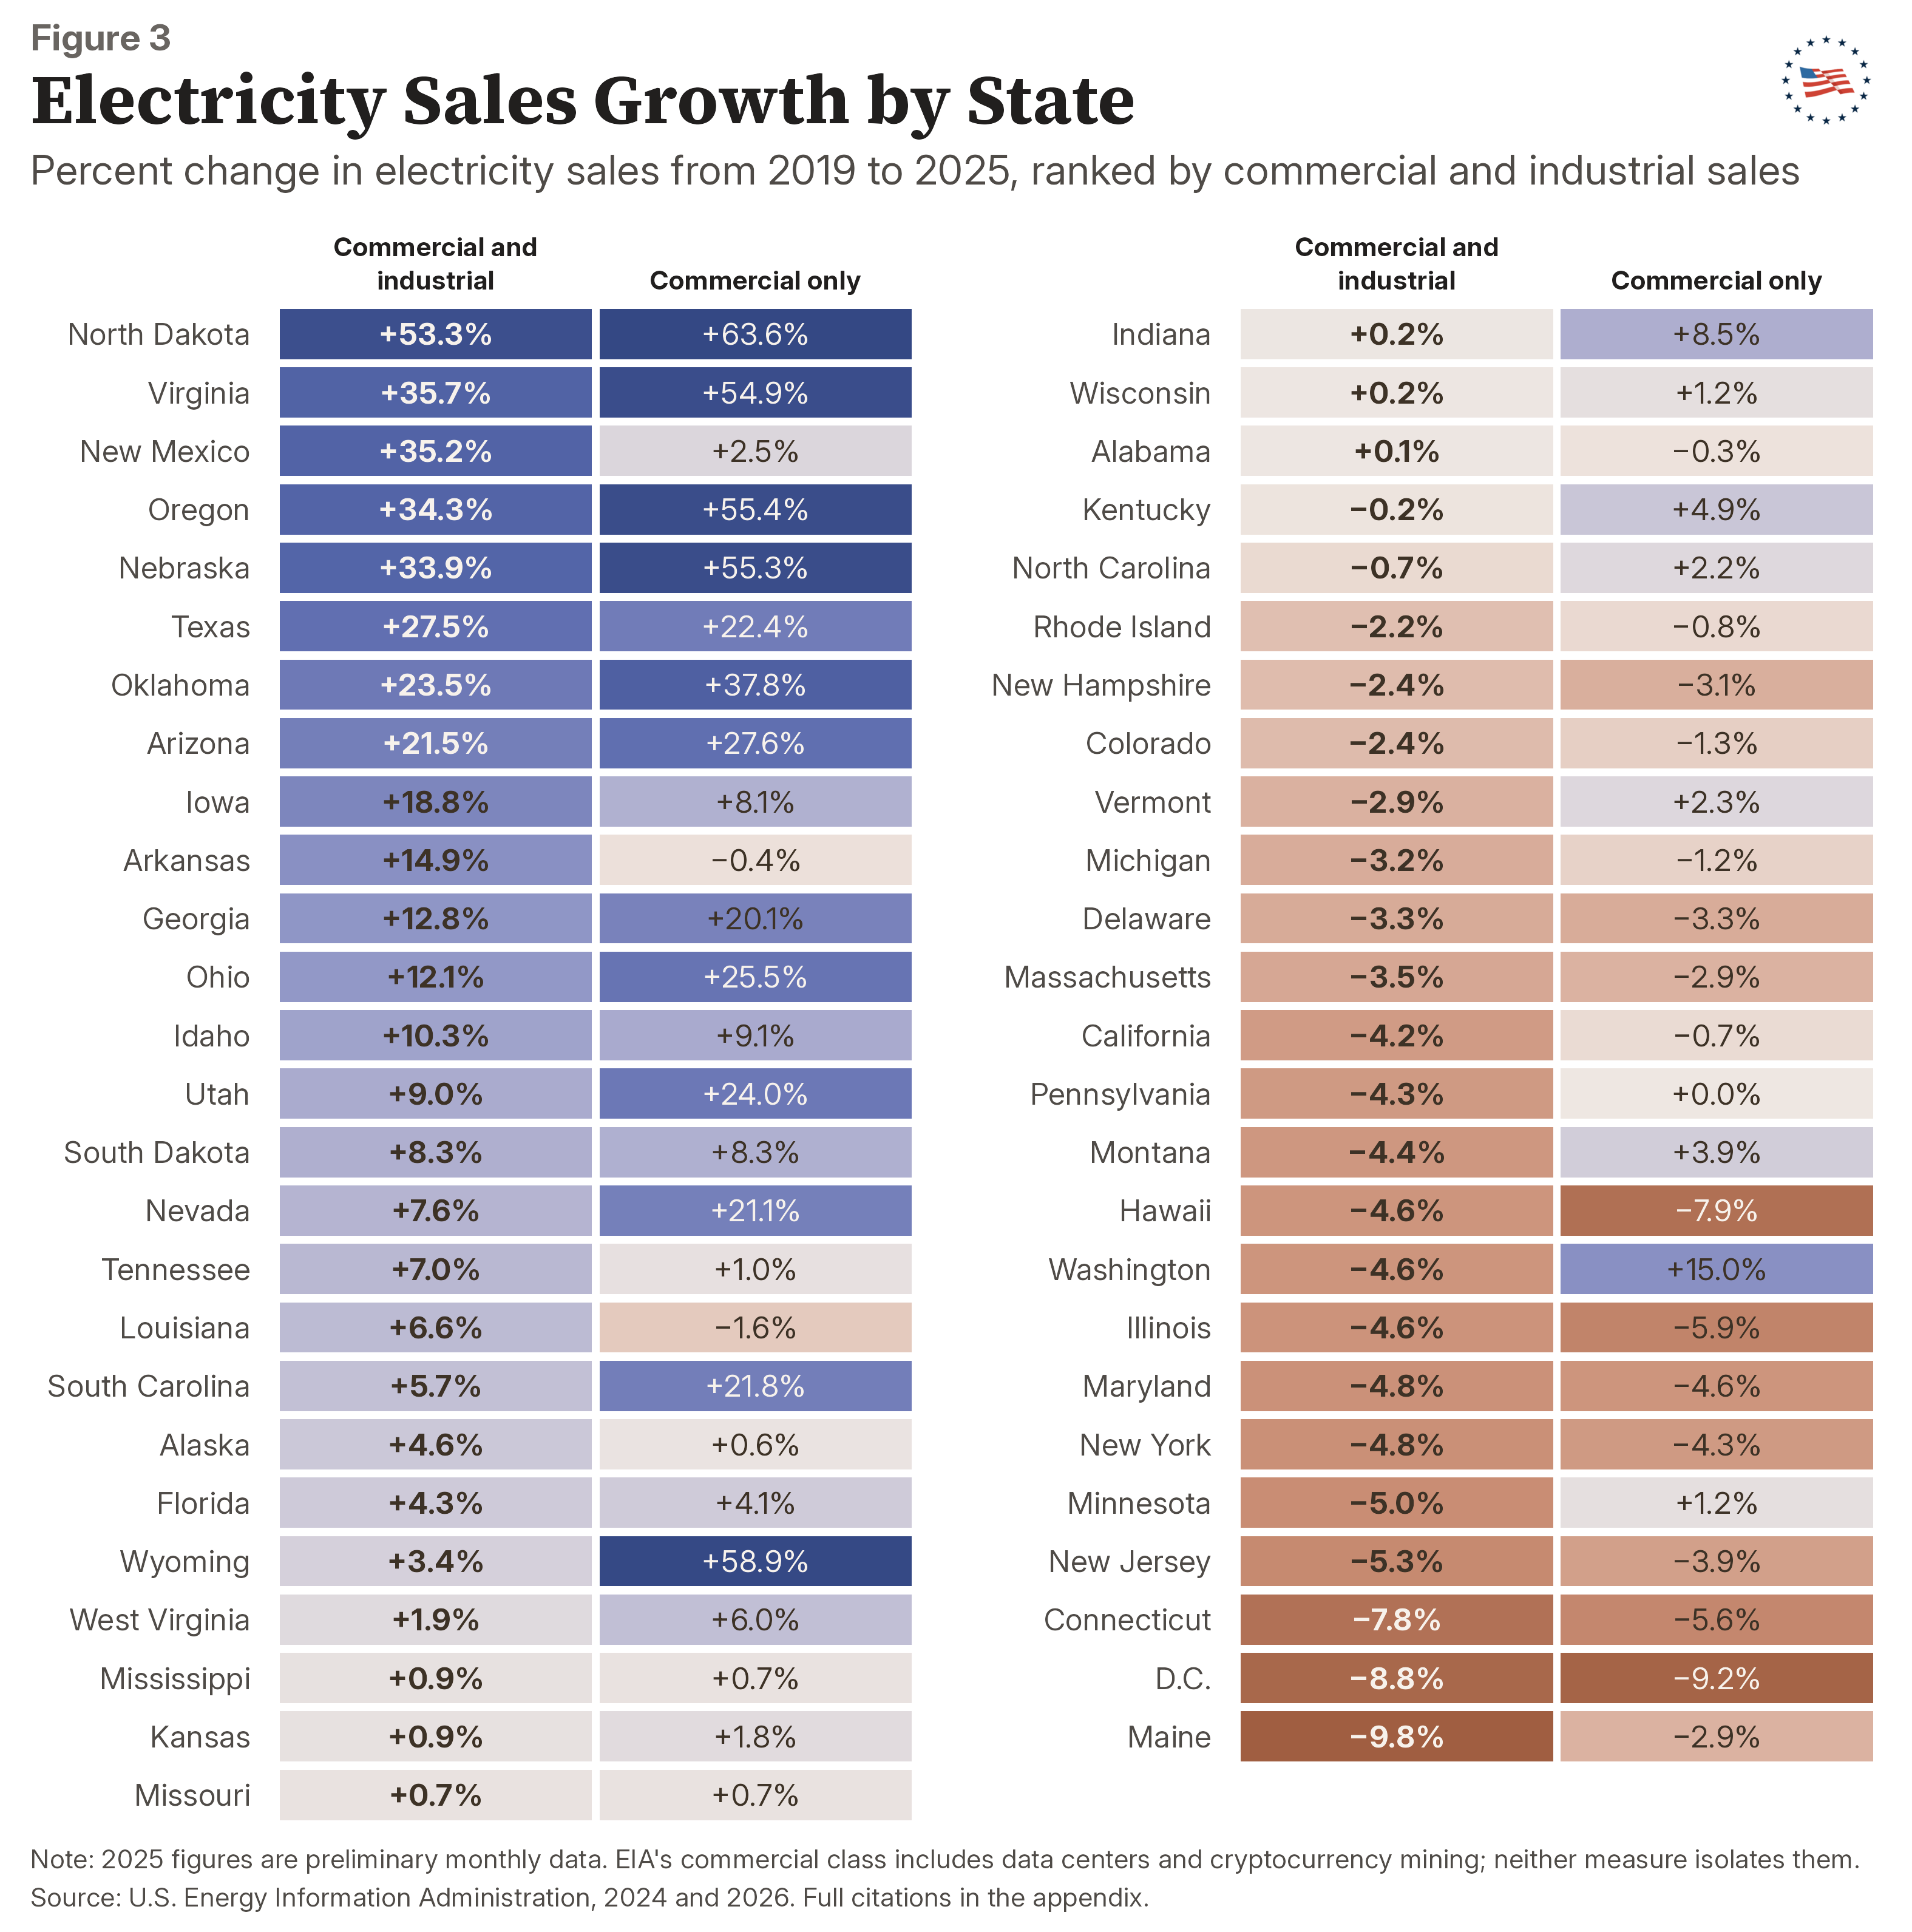
In each panel of Figure 3, the left column corresponds to growth in combined commercial and industrial electricity sales, while the right column represents growth in commercial sales. States are ranked by the combined measure, with blue shading indicating growth and brown shading indicating decline.11 Neither series is purely a data center series, however, as both also contain data regarding electric vehicle charging, building electrification, cryptocurrency mining, and typical firm growth and decline in each state. Nationally, growth on the combined measure between 2019 and 2025 was 7.3 percent.
As Figure 3 also shows, there is tremendous variation across the states in electricity sales growth. In particular, North Dakota leads the nation at 53.3 percent on the combined measure, followed by Virginia at 35.7 percent, New Mexico at 35.2, Oregon at 34.3, and Nebraska at 33.9. Ten states grew by more than 14 percent, almost twice the level of the national figure.
On the other hand, 22 jurisdictions consumed less electricity in these classes in 2025 than in 2019. Maine was at the lowest level at negative 9.8 percent, followed by the District of Columbia at negative 8.8 percent, Connecticut at negative 7.8 percent, and New Jersey at negative 5.3 percent. Minnesota, New York, Maryland, Illinois, Washington, and Hawaii all follow, clustering near negative 5 percent.
A state near the bottom of the list, however, may not necessarily be failing to attract data centers; in fact, such a state may be attracting them while losing more load elsewhere. Utilities and grid operators must plan for where that load will fall and how large it will be. In the following section, we discuss these entities and their own forecasts.
The supply of electricity in the United States is organized in two primary ways—via a vertically integrated utility or through a wholesale market run by a regional transmission organization (RTO) or an independent system operator (ISO). In a vertically integrated utility, a single utility owns the generation, transmission, and distribution in a particular territory. The utility’s plans are determined by a state public service commission through an Integrated Resource Plan (IRP), generally filed every few years. The IRP contains load forecasts and proposals to meet this load. Georgia Power, which is regulated by the Georgia Public Service Commission, is an example of a vertically integrated utility. RTOs and ISOs, on the other hand, coordinate aggregate electric transmission over a particular region and operate wholesale markets within which independent generators compete to sell electricity to utilities and other load-serving entities. PJM Interconnection, which serves all or parts of 13 states and the District of Columbia, is the largest RTO in the nation. The two models also overlap: Dominion Energy Virginia, which serves the Northern Virginia data center cluster, is a vertically integrated utility that operates inside PJM.12
The two structures constrain the growth of electricity supply differently. In a vertically integrated system, a supply constraint is commission approval. In RTO and ISO regions, on the other hand, new growth depends on the interconnection of generators that compete with one another.
Figure 4 depicts published forecasts of peak load growth to 2030 for both Georgia Power and PJM. The horizontal axis is the year each forecast was published.
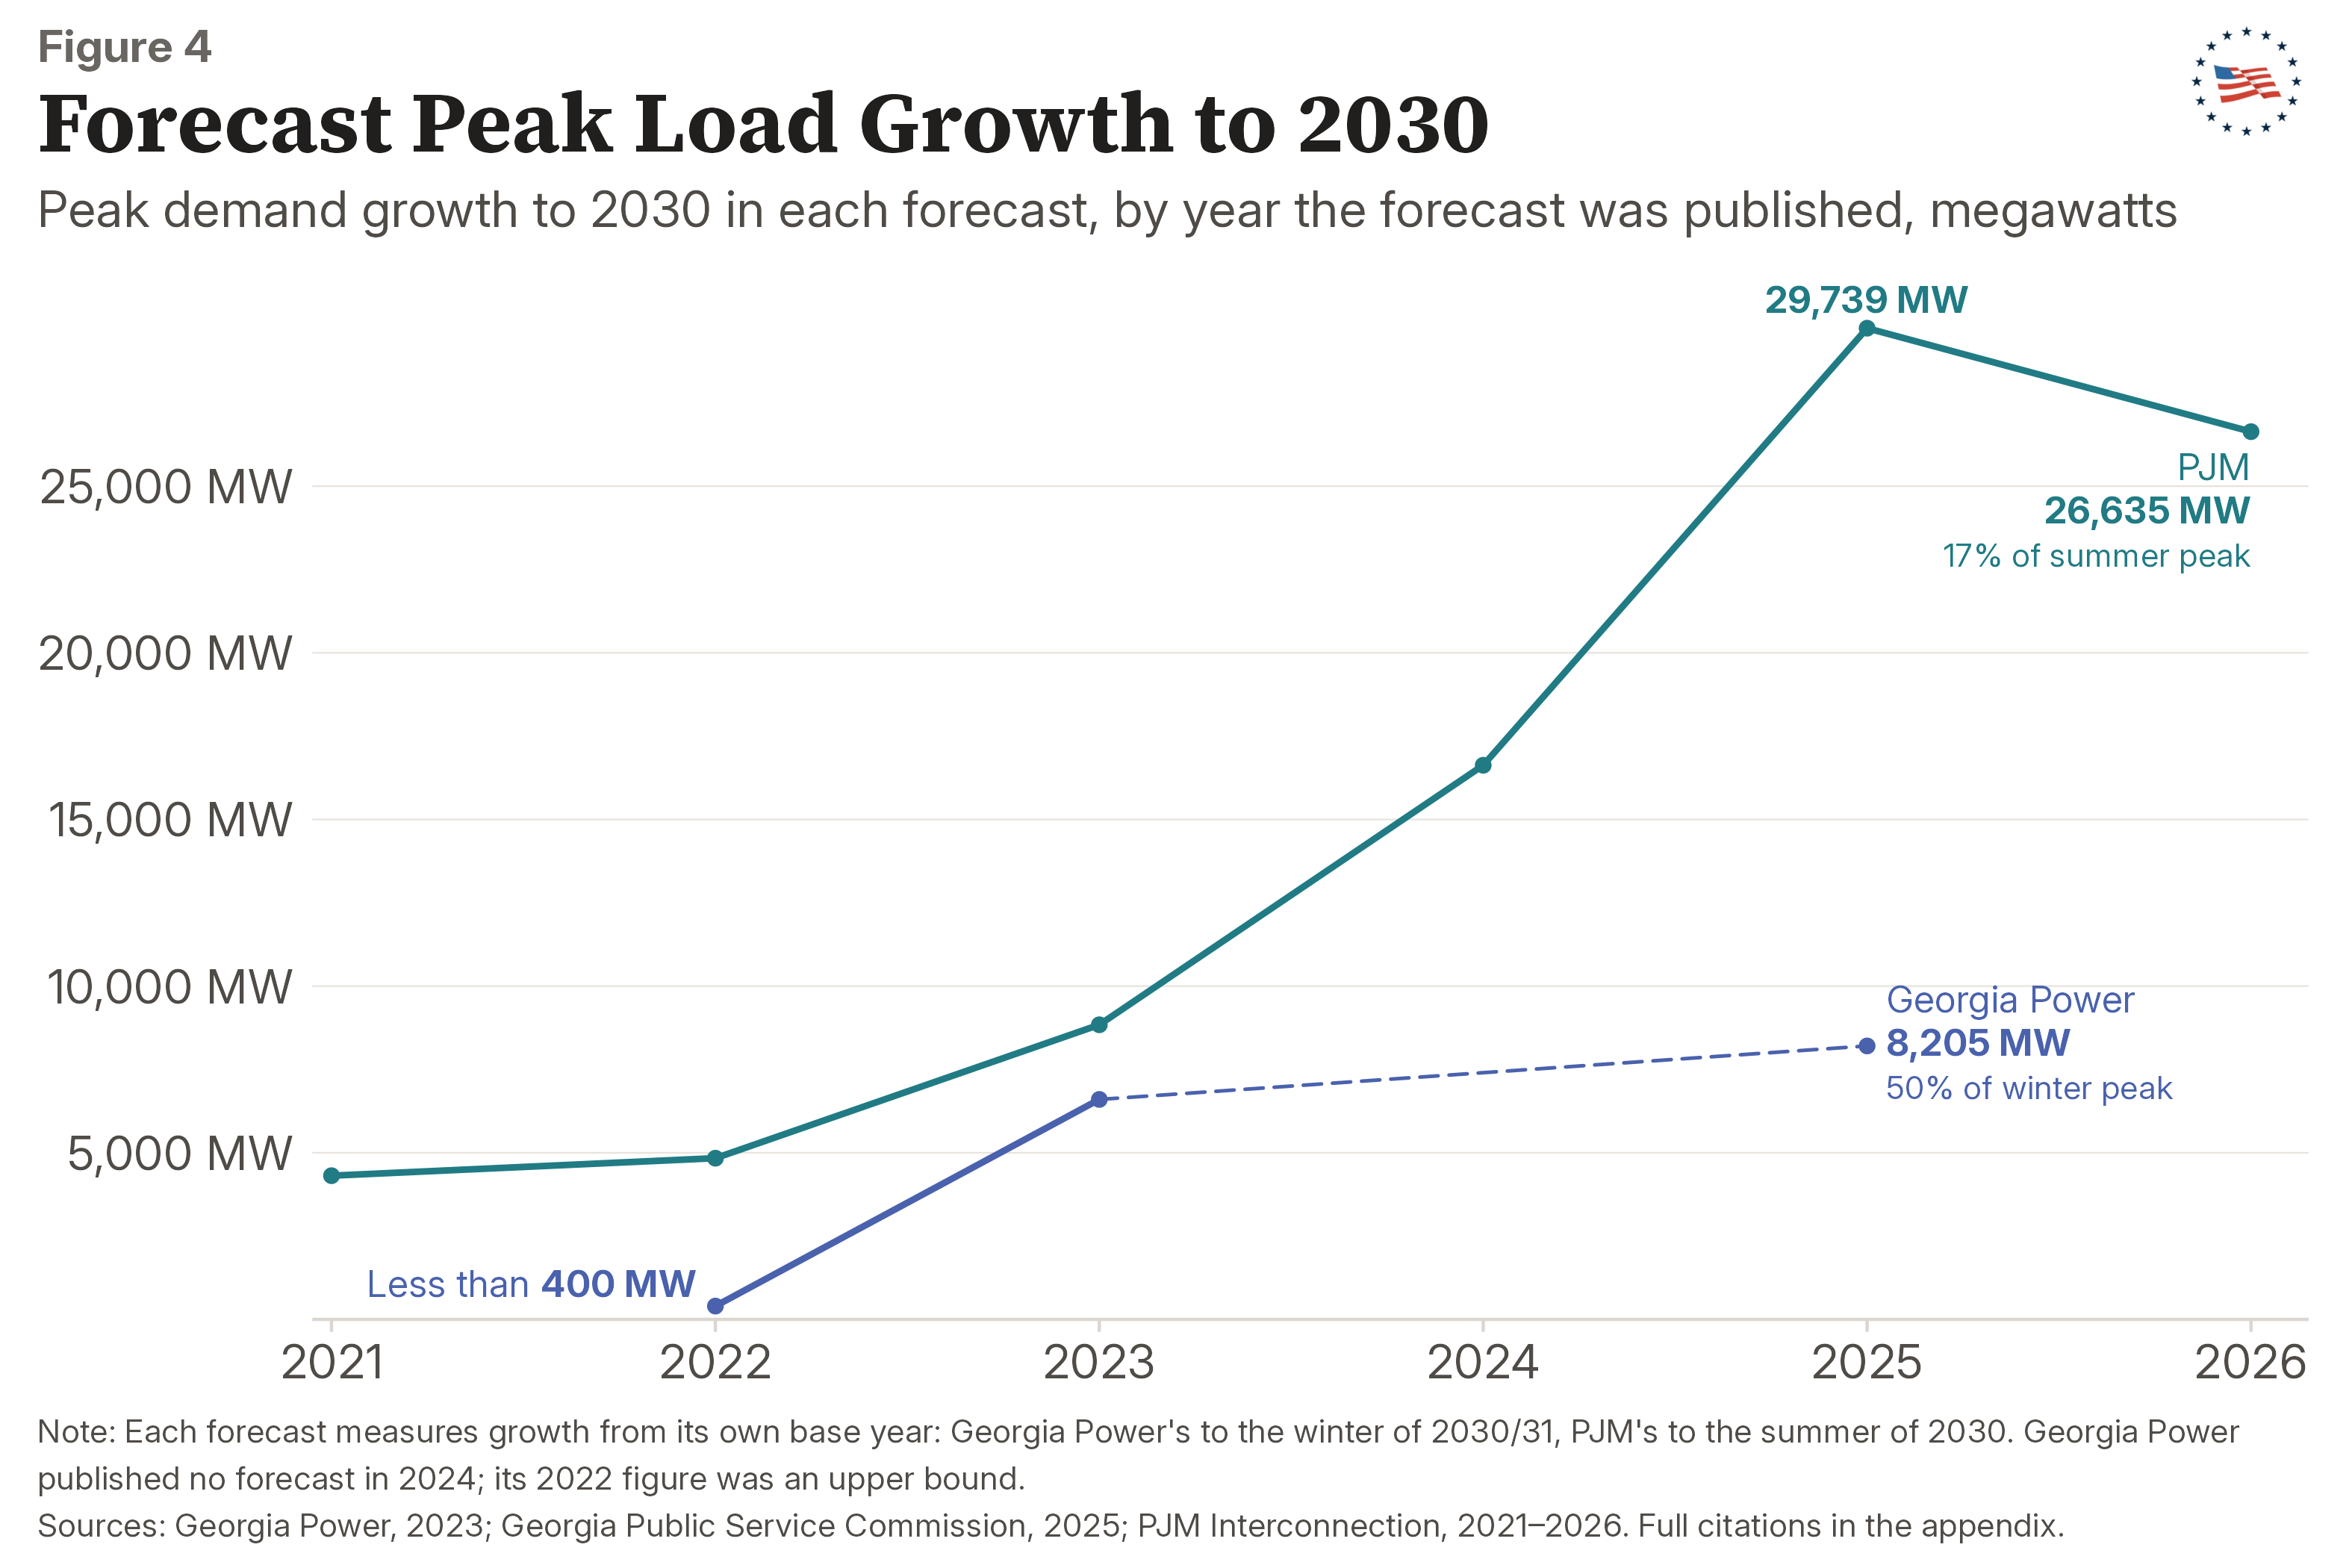
As Figure 4 shows, Georgia Power’s 2022 IRP predicted less than 400 megawatts (MW) of peak load growth through the winter of 2030–31. One year later the 2023 IRP Update increased that estimate to 6,600 MW, almost 17 times the previous forecast. Subsequently, the 2025 IRP raised the estimate again to 8,205 MW as filed (approximately 8,500 MW in the plan the Commission approved), about half of the 16,264 MW winter peak Georgia Power projected for 2024–25.13
As Figure 4 illustrates, PJM’s 2021 report indicated 4,312 MW of growth to 203014; the 2022 report 4,83715; the 2023 report 8,84016; the 2024 report 16,62617; and the 2025 report 29,739.18 PJM’s 2026 forecast projects 3,104 MW less growth to 2030 than its 2025 forecast did, the first downward revision in the series, although because it starts from a higher base, its forecast of the 2030 peak itself fell by only 875 MW, or 0.5 percent.19 PJM attributes this recent reduction to updates to its electric vehicle forecast, economic assumptions, and large-load adjustments.20
No forecast is perfect, but forecasting error—especially major error—has consequences. In particular, under-forecasting threatens reliability, while over-forecasting builds generation and transmission that ratepayers then fund for decades. Neither risk can be weighed from outside. Fortunately, PJM publishes every vintage’s forecast level in a downloadable workbook21; however, Georgia Power discloses less. Such disparities in transparency make it difficult to evaluate the quality of forecasts across regions and point to a more fundamental need to improve federal data collection. Better and more comprehensive data would provide utilities, regulators, researchers, and policymakers a stronger foundation for forecasting future demand.
Utilities and grid operators such as those mentioned in this section, however, are not the only institutions that need to price load. States need to price load as well and have also had challenges in this regard. We discuss these issues in the next section.
Thirty-eight states, by Figure 6’s count, exempt data center equipment, and in many cases the electricity used to run it, from certain taxes.22 Such policies impact tax revenues, and Figure 5 compares state-level predictions of these impacts with what was later reported.
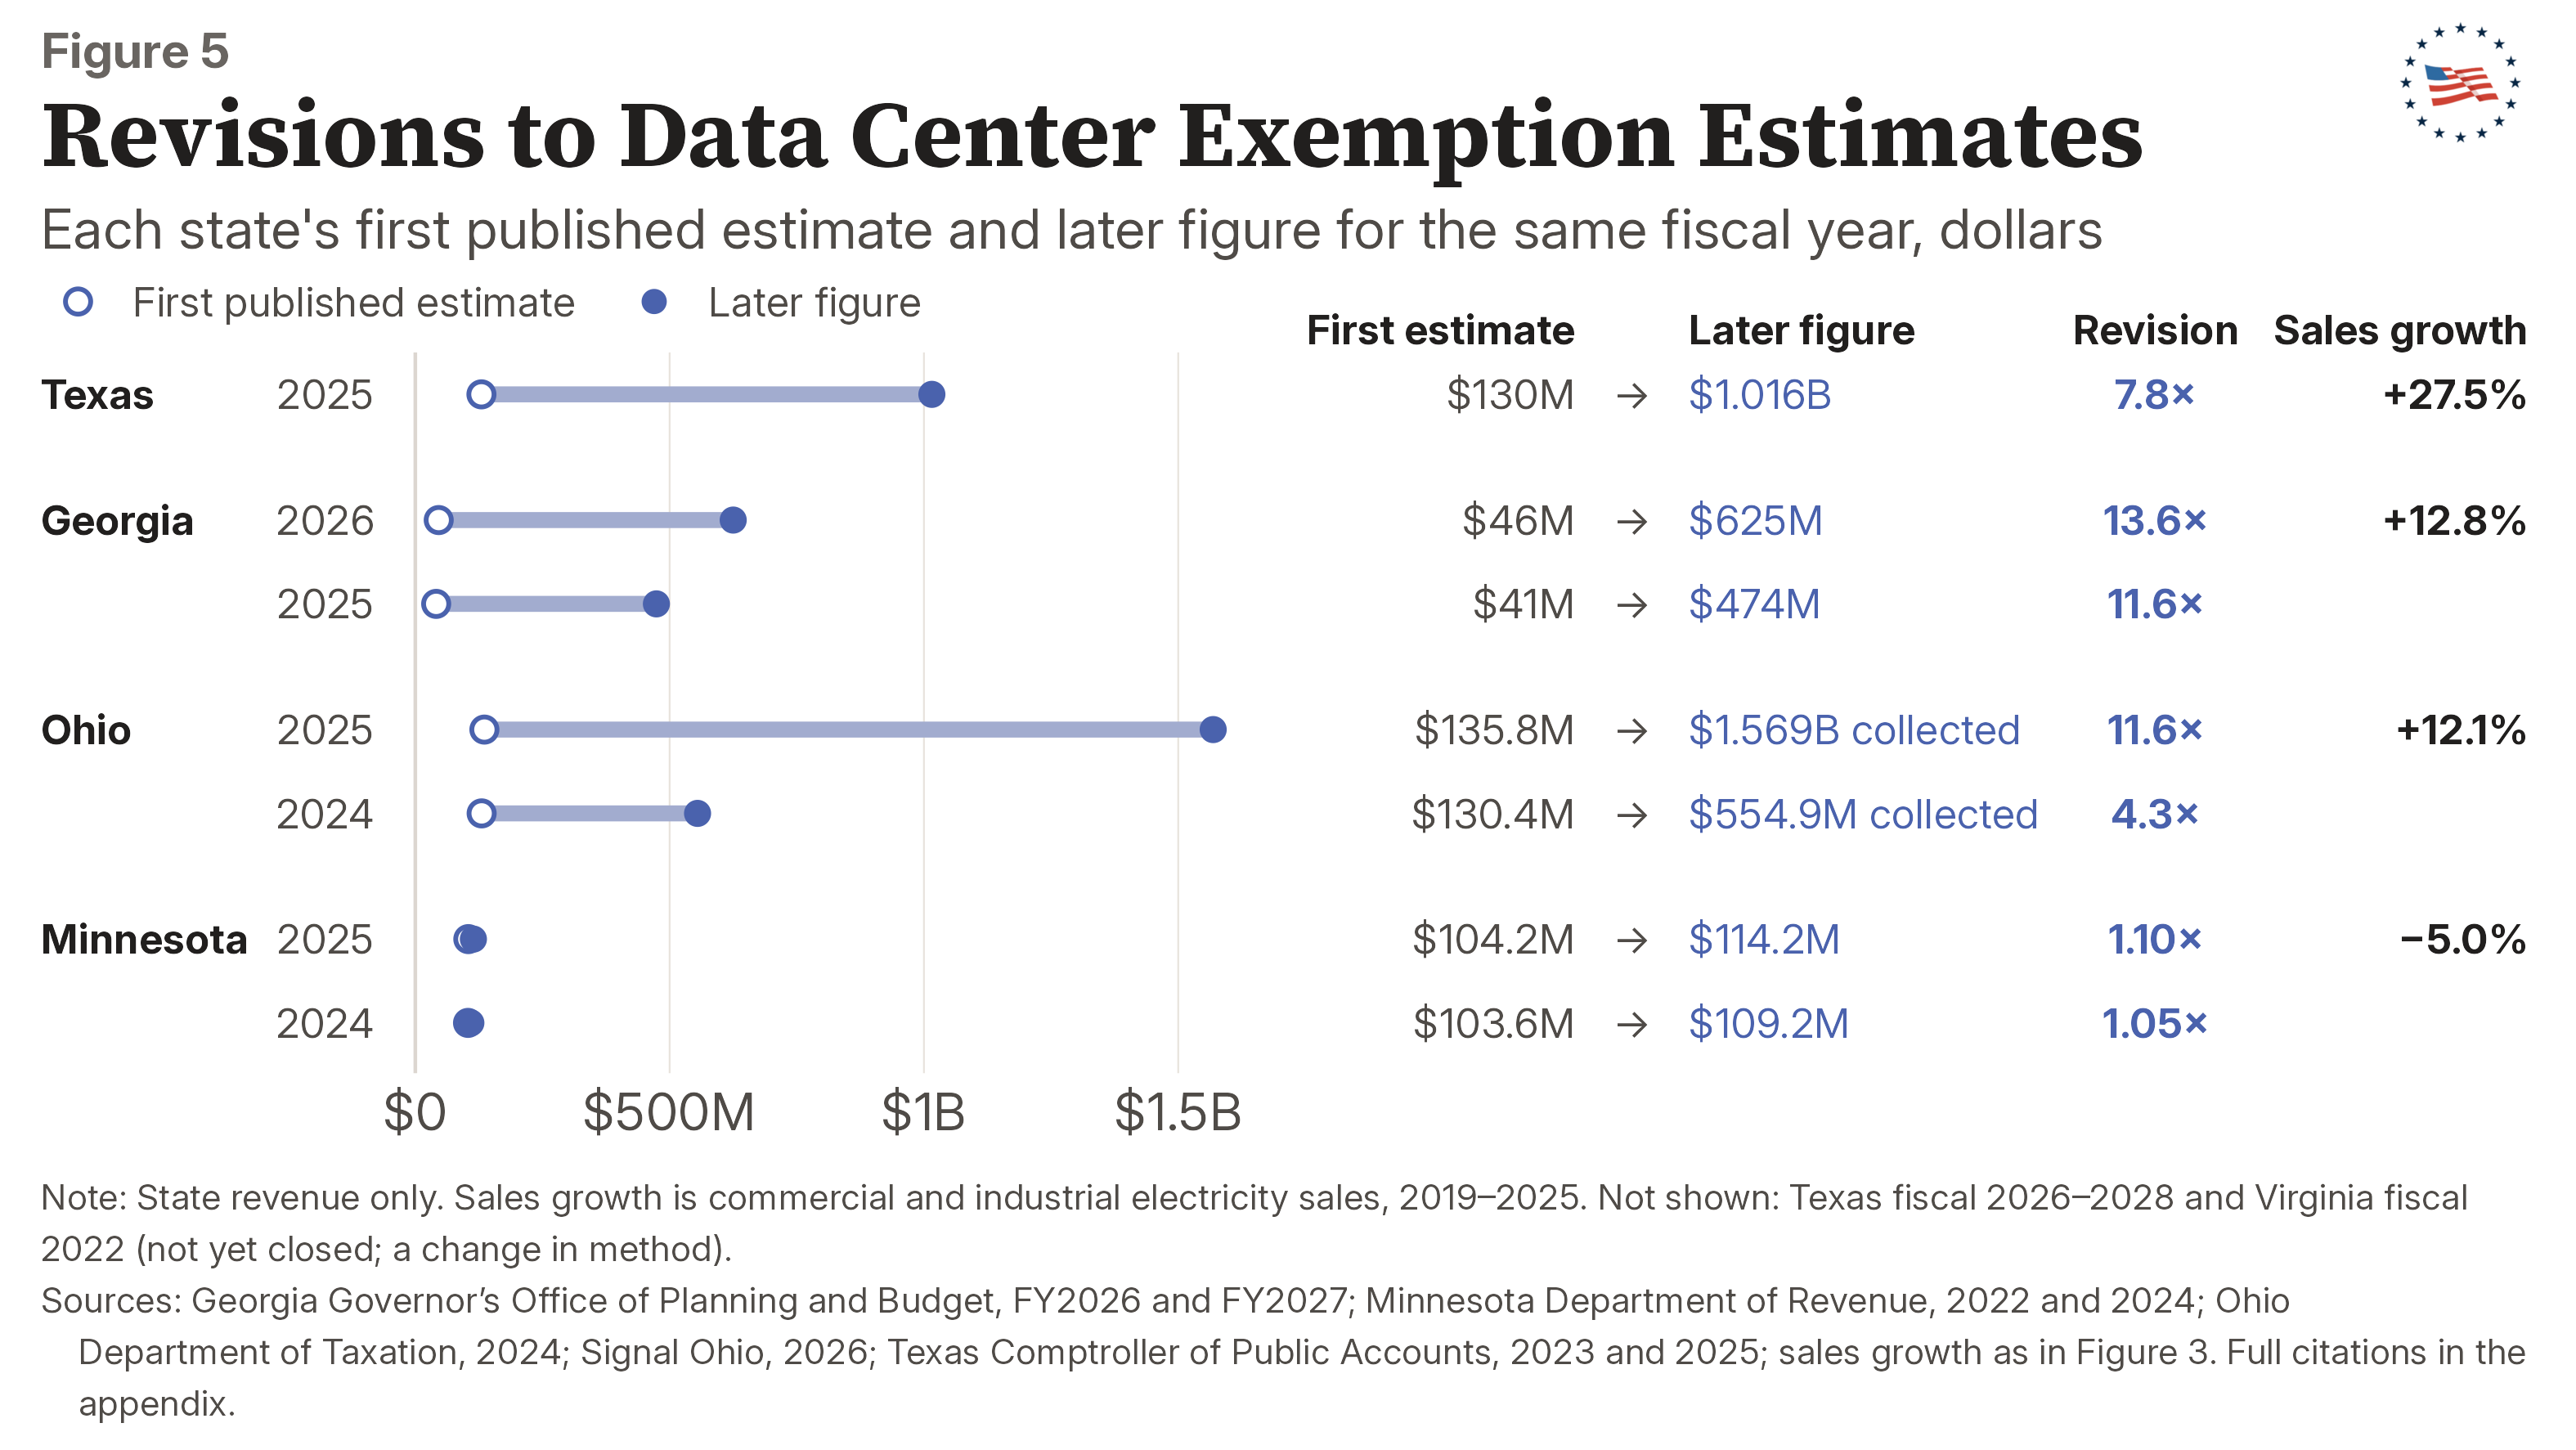
Figure 5 shows several states that had published both an initial estimate of the cost of a tax exemption and a subsequently reported statistic. In particular, Ohio estimated $130 million and $136 million of lost revenue for fiscal years 2024 and 202523, while the amounts the Ohio Department of Taxation provided to reporters in May 2026 were $554.9 million and $1.569 billion, respectively—4.3 and 11.6 times the projections.24,25 Texas also revised one of its own estimates: in February 2023 it projected $130 million for fiscal 2025, and in January 2025 it raised that projection to $1.016 billion.26,27 Georgia revised its forecasts by similar magnitudes, attributing its most recent revision to “new data on a dramatic increase in data center construction.”28
As also shown in Figure 5, however, Minnesota’s projections were much more accurate than those of the other states mentioned above. For example, its 2022 Tax Expenditure Budget estimated the data center equipment exemption at $103.6 million for fiscal 2024 and $104.2 million for fiscal 2025; its 2024 edition put those same two years at $109.2 million and $114.2 million.29 But this consistency is not evidence of better forecasting. In particular, as illustrated in Figure 3, Minnesota’s commercial and industrial electricity sales fell 5.0 percent between 2019 and 2025, 47th of the 51 jurisdictions on Figure 3’s measure, while Georgia, Ohio, and Texas all rank among the top 12. Minnesota’s estimate held because the load it was pricing never arrived. Across these four states, the forecasts missed badly where the buildout landed and held where it did not.
Another issue is transparency. Notably, Ohio’s subsequent statistics reported in Figure 5 were not published on the state’s website. The Ohio Department of Taxation calculated what the exemption had cost and provided the figures to a news organization.30 States should publish what these exemptions actually cost, not only what they were first estimated to cost.
Of course, there are myriad ways states can implement tax reform to attract data centers, and a comparison of different approaches is a worthwhile avenue of future research. Regardless, as Figure 5 illustrates, a number of states that have priced this exemption have missed by a wide margin. As a result, states should be required to disclose what these programs cost and review them periodically.
We examine two policy instruments across all 51 jurisdictions:
Figure 6 shows which jurisdictions use each policy:
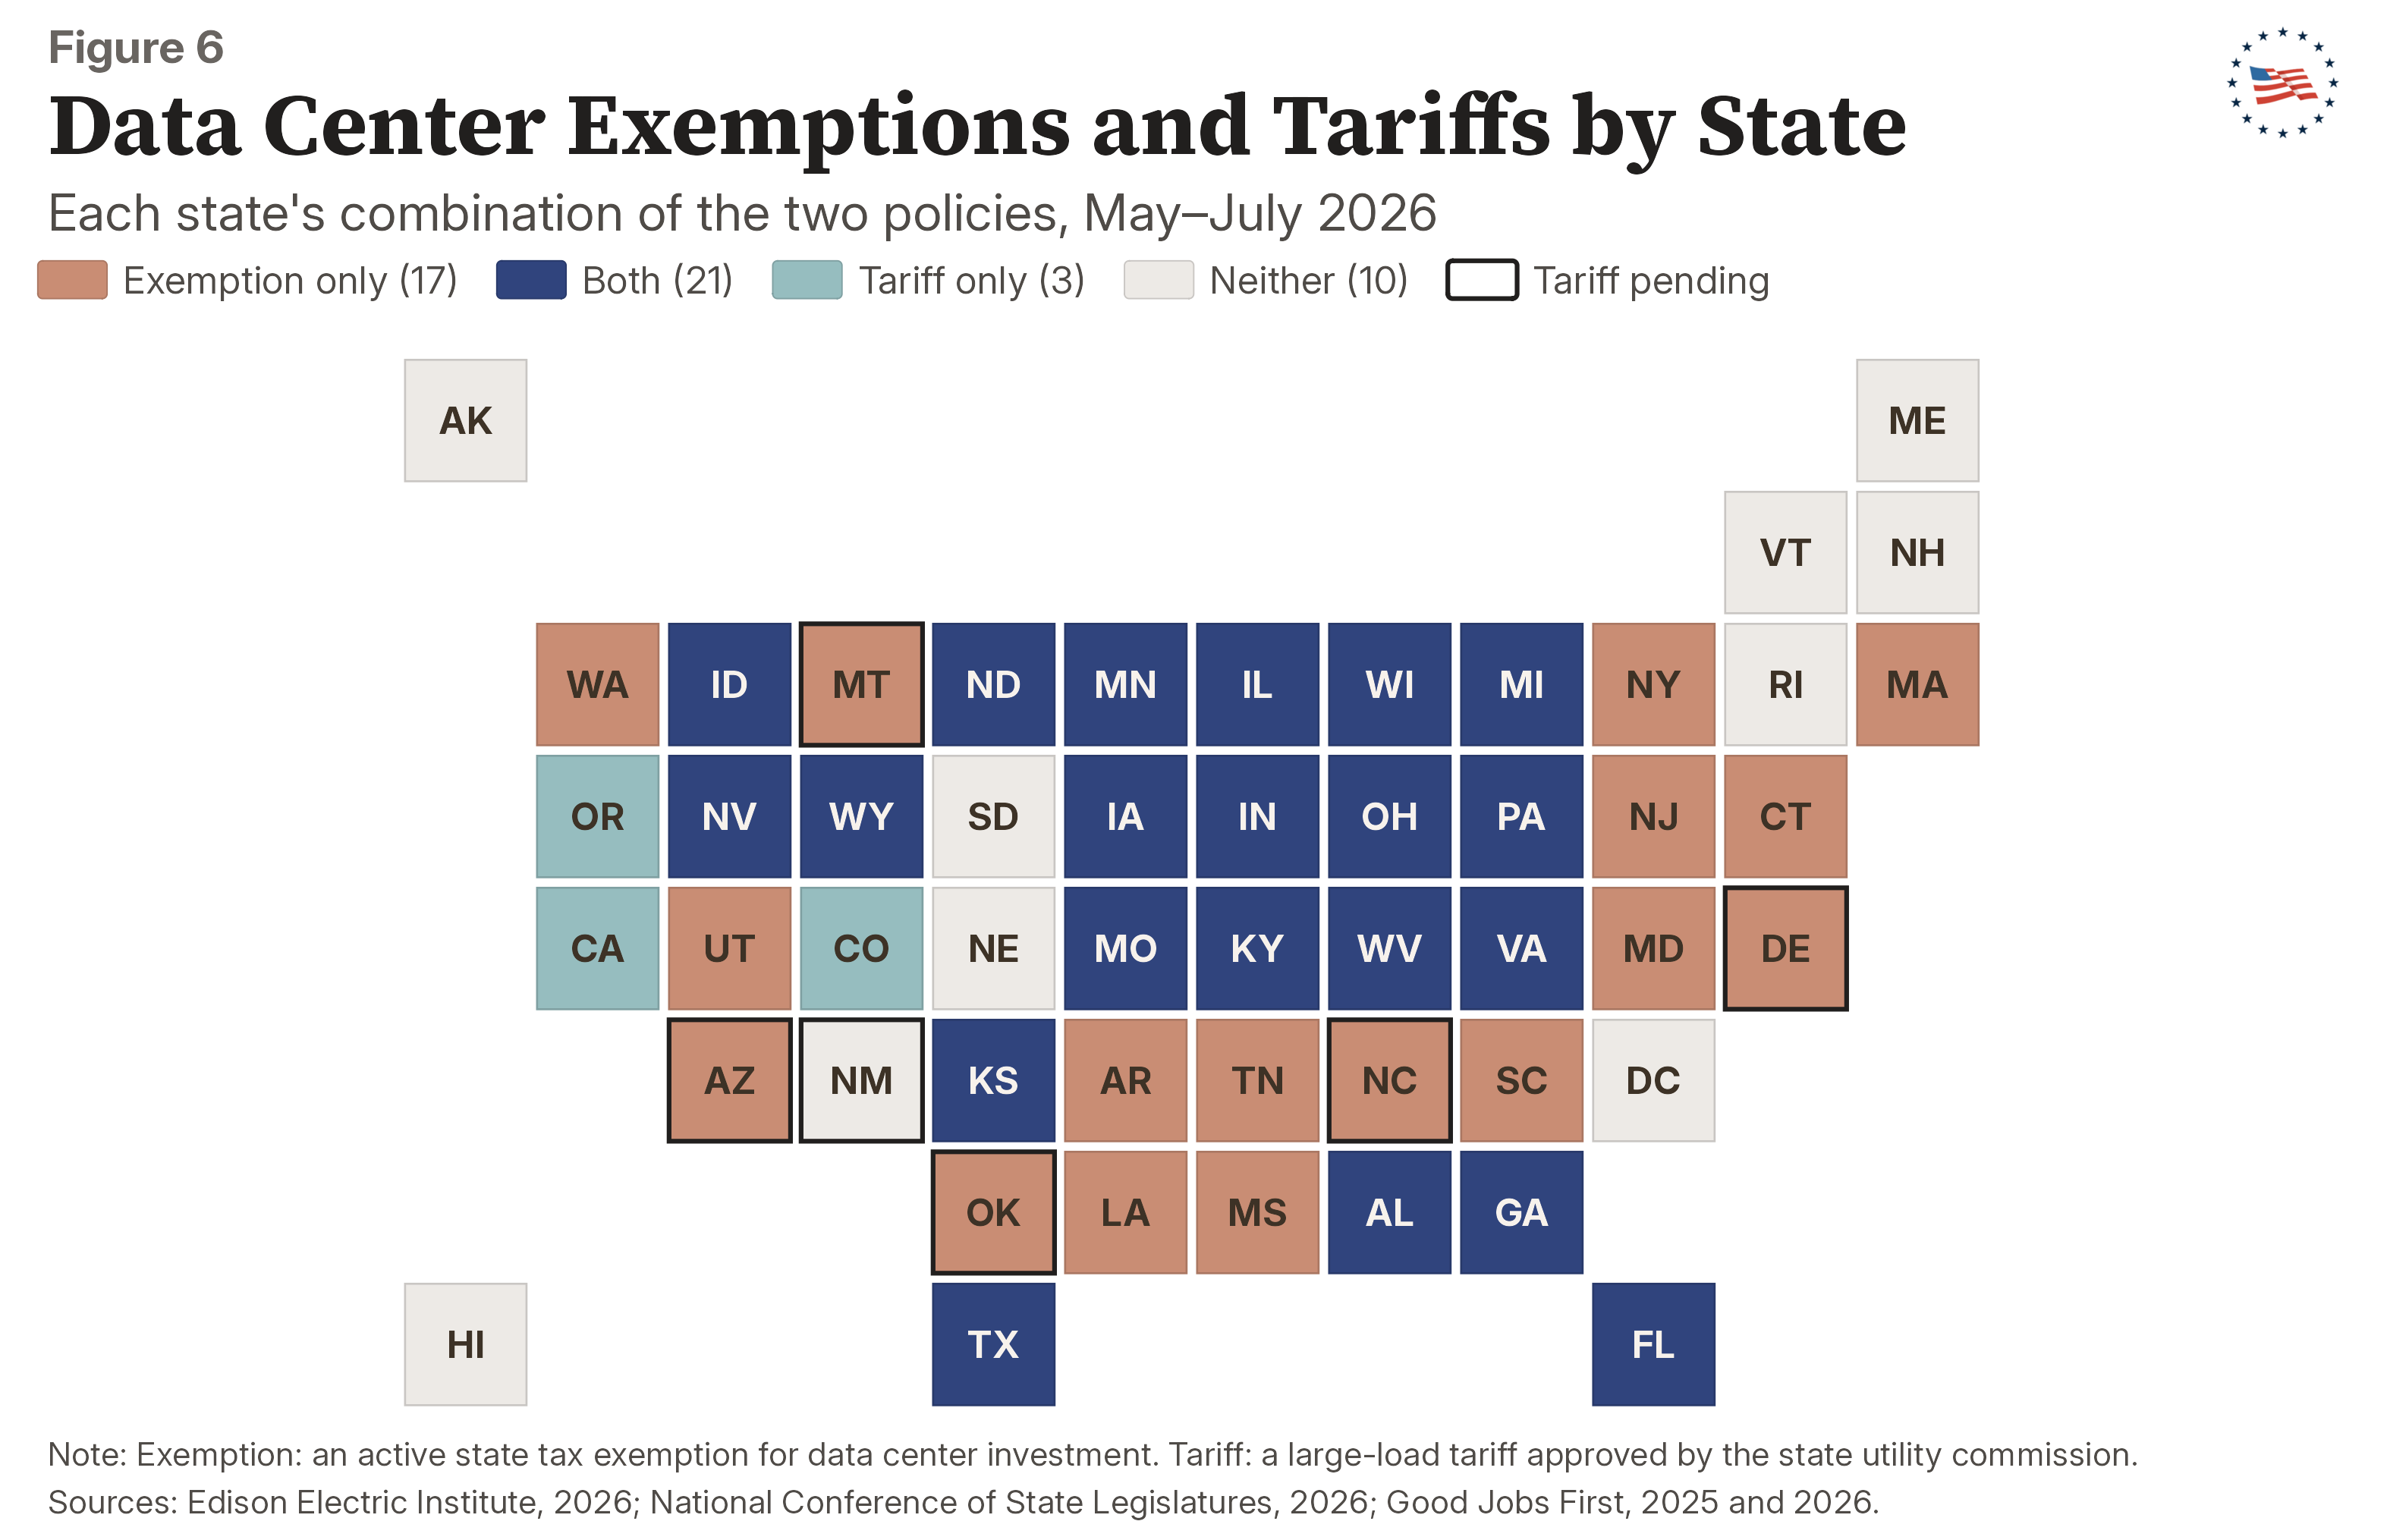
As Figure 6 shows, 21 states have both policies in place. Three states have approved a large-load tariff without granting tax exemptions, namely, California, Colorado, and Oregon. As Figure 6 also shows, however, 17 states have an active data center tax exemption with no approved large-load tariff. Five of these states have a tariff pending before their commission and may not remain in that category for long. These states are Arizona, Delaware, Montana, North Carolina, and Oklahoma.
Checked against Figure 3, only four of the 17 states; in particular, Oklahoma, Arizona, Arkansas, and Utah are growing faster than the national average, and two of those four, Arizona and Oklahoma, have a tariff pending. Most of the remaining 13, including Connecticut, New Jersey, New York, and Maryland, are states whose combined commercial and industrial sales are falling and may not yet have needed a large-load tariff; Washington, where commercial sales alone grew about 15 percent, is the exception to watch.
As the light gray states in Figure 6 illustrate, 10 jurisdictions hold neither instrument. Seven of them; namely, Maine, Vermont, Rhode Island, New Hampshire, Alaska, Hawaii, and the District of Columbia, may not be attracting significant data center investment and therefore have not had reason to act. However, New Mexico and Nebraska rank third and fifth in Figure 3’s growth, and South Dakota grew faster than the national average. Nebraska, the only state served entirely by public power, sets rates through utility boards rather than a state commission, so a commission-approved tariff is not applicable to the state.34
Large-load tariffs are intended to place the cost of serving new load on the customers who caused it, rather than on customers who did not. Regardless, such a tariff is a bandage: new load in principle raises prices because it meets a supply of affordable and reliable power that policy has kept scarce, and permitting and interconnection reform and an all-of-the-above strategy address that scarcity directly.35 We discuss another potential solution to this issue in the next section.
A third approach—known as Consumer-Regulated Electricity (CRE)—removes the forecasting problem rather than managing or allocating its cost. A “build-your-own-power” approach, CRE would permit a privately financed electric utility, physically islanded from the regulated grid, to serve new nonresidential load under voluntary contract without state economic regulation of its rates, while remaining fully subject to environmental, siting, and safety law.36 The American Legislative Exchange Council has adopted a model act on this design,37 a federal companion, the Decentralized Access to Technology Alternatives Act of 2026 (S. 3585), was introduced by Senator Tom Cotton in January 2026,38 and Louisiana has both considered enabling legislation and opened a commission docket on private-use networks.39
Because CRE serves only new load, on an islanded system and at contract prices, a forecast that is incorrect in either direction would have zero impact on ratepayers. Several states have made significant strides in pursuing CRE, including New Hampshire, Utah, and Ohio.40,41,42 CRE eligibility has thus far been aimed mainly at new load; Utah’s law, for example, reaches new or added load of 100 megawatts or more but not a customer’s existing load.43 Although this restriction prevents users from leaving the grid and unloading fixed costs from existing assets onto ratepayers, such a blanket limit may be overly onerous. A better question is not whether a customer’s load is new, but rather whether its departure from the grid would impose meaningful costs on existing ratepayers. That concern is largely irrelevant for firms having long-abandoned grid connections, facilities whose customer-specific infrastructure has already been fully depreciated, or existing customers seeking to supply a substantial amount of new load in an alternative capacity. The restriction also shields incumbent utilities from competition for their existing large customers, weakening the pressure to keep large-load tariffs competitive.
As Figures 2 and 4 show, forecasts of data center electricity demand carry significant uncertainty and, as a result, price risk. CRE addresses that risk by creating islanded grids; large-load tariffs transfer this price risk through contracts. The ideas suggested in this section can give lawmakers, utilities, and grid operators a variety of options to manage these risks.
As a result of the analysis presented in this paper, we have the following policy recommendations. Each holds regardless of whether the buildout proves larger or smaller than predicted.
In March 2026, the U.S. Energy Information Administration (EIA) launched voluntary pilot field studies of data center energy use covering 196 identified companies in Texas, Washington State, and the Northern Virginia and District of Columbia area.44 Congress should make this collection broader and more permanent. In particular, Congress should pair this collection with a large-load reporting category on Form EIA-861, which statisticians and economists can use to improve data collection capacity. The Bipartisan American Affordability and Jobs Act of 2026, introduced in the Senate in September 2026, would do exactly this, directing EIA to revise Form EIA-861 to include load from data center entities.45 Because Form EIA-861 is filed by suppliers, not customers, this change would impose no new reporting requirements on data centers or other large-load customers themselves.
Figure 5 demonstrates that a number of states were significantly off in terms of revenue projections regarding data center tax exemptions. Ohio, Georgia, and Texas each revised their estimates of revenue impacts by factors ranging from four to nearly 14 times prior estimates. In Ohio’s case, the state did not even publish the actual amounts but instead reported them to a news organization.46 More comprehensive data, as recommended above, can help inform the accuracy of forecasts. States should publish these figures and review these exemptions on a fixed schedule so that a legislature extending an exemption, as Michigan’s did in 2024 when it pushed its sunset to 2050, does so knowing what the prior decade had cost.47
The Ratepayer Protection Act (H.R. 9340), which passed the House in September 2026 but fell short of the 60 votes needed to advance in the Senate on September 30, 2026, would add a large-load standard to Section 111(d) of the Public Utility Regulatory Policies Act, requiring each state commission to consider, after notice and a hearing, whether to make customers with 100 megawatts or more of peak demand pay the full incremental cost of the generation, transmission, and distribution built to serve them.48 The standard would push commissions toward large-load tariffs, the remedy discussed in this paper. However, large-load tariffs keep new load inside the regulated rate base, rely on utilities’ own estimates of incremental cost, and can invite states to single data centers out for less favorable treatment. As mentioned above, a more fundamental issue is energy supply, and large-load tariffs only provide a bandage to a broader problem. In addition to expanding energy supply, states should also authorize CRE, in the context of the broader eligibility framework discussed in the preceding section. Consumer-regulated electricity goes further by removing the cost-shift risk altogether; at the federal level, Congress should pair any cost-allocation standard with a path for it, such as the one proposed in the Decentralized Access to Technology Alternatives Act, introduced in the Senate in January 2026.49
There is no doubt that the use of AI is increasing electricity consumption. A key constraint on more electricity is the bottleneck created by the extensive permitting process. One potential solution is the bipartisan permitting reform commission proposed in Dayaratna and Miller (2026), which would evaluate and streamline permitting regimes for all types of energy.50 Interconnection deserves the same attention: in RTO and ISO regions, new supply depends on connecting competing generators to the grid, and a permitted plant that cannot connect adds nothing. These policies should be sought in statute so they can survive subsequent changes in administration.
Across nations and across the historical record, energy consumption and human flourishing rise together.51 As a result, energy supply should be built on an all-of-the-above basis, and lawmakers should not let emissions accounting decide which resources qualify. Climate modeling at Advancing American Freedom has shown that even if the United States were to eliminate all energy-related CO2 emissions, projected warming would be only about 0.24 degrees Celsius lower in 2100. State-level impacts are even more negligible: even Texas, the largest emitter, would avert only about 0.03 degrees.52 Furthermore, the social cost of carbon, the key statistic used to justify carbon-based regulation, is highly sensitive to user-selected assumptions, which is why it should not migrate into state permitting decisions or utility rate cases.53 Whatever one concludes about climate policy generally, a state weighing a certification docket is trading a measurable cost against a climate benefit too small to measure.
As of September 15, 2026, lawmakers in 16 states were weighing bills to halt data center development, ranging from one-year pauses to prohibitions running to 2030; New York’s passed the legislature, Maine’s was vetoed, and Maryland’s failed.54 The premise is rarely that data centers are objectionable in themselves; generally speaking, the concern is that the grid is not ready and that costs might shift to ratepayers, both of which have been addressed in the recommendations above. Lighter instruments, such as large-load tariffs and consumer-regulated electricity, are available before states resort to prohibition. The answer to a grid that is not ready is to make it ready; states should meet rising demand by expanding supply rather than continuing to suppress it.55
As the use of AI continues to proliferate, pursuing policies to provide abundant and reliable electricity remains a laudable objective. Demand is rising, associated forecasts have been revised severalfold, and several states badly underestimated what their tax exemptions would cost. Better data, a full accounting of those exemptions, and room for new load to pay for its own power would let lawmakers act on what is actually happening rather than on the last estimate. At the federal level, Congress should bring data center load into federal energy statistics and speed the permitting and interconnection of new supply. States, for their part, should authorize consumer-regulated electricity, publish what their exemptions actually cost, and meet rising demand by expanding supply rather than imposing moratoria. American leadership in this new era will increasingly depend on whether we can supply the energy required not only to sustain demand here but also to foster the growth and innovation necessary to lead the world.
U.S. Energy Information Administration. Monthly Energy Review, Table 7.6, “Electricity End Use.” Accessed August 14, 2026. https://www.eia.gov/totalenergy/data/browser/csv.php?tbl=T07.06.
Electric Power Research Institute. Powering Intelligence: Analyzing Artificial Intelligence and Data Center Energy Consumption. May 2024. https://www.epri.com/research/products/000000003002028905.
Electric Power Research Institute. Powering Intelligence 2026: Updated U.S. Data Center Scenarios. February 2026. https://web.archive.org/web/20260305085236id_/https://powering-intelligence.epri.com/assets/executive-summary.html-BgCp-8vK.js.
International Energy Agency. Energy and AI. April 2025. https://www.iea.org/reports/energy-and-ai.
Koomey, J. G. Growth in Data Center Electricity Use 2005 to 2010. Analytics Press, 2011. http://www.analyticspress.com/datacenters.html.
Masanet, E. R., R. E. Brown, A. Shehabi, J. G. Koomey, and B. Nordman. “Estimating the Energy Use and Efficiency Potential of U.S. Data Centers.” Proceedings of the IEEE 99, no. 8 (2011): 1440–53. https://doi.org/10.1109/JPROC.2011.2155610.
Shehabi, A., S. J. Smith, A. Hubbard, A. Newkirk, N. Lei, M. A. B. Siddik, B. Holecek, J. Koomey, E. Masanet, and D. Sartor. 2024 United States Data Center Energy Usage Report. Lawrence Berkeley National Laboratory, December 2024. https://eta-publications.lbl.gov/sites/default/files/2024-12/lbnl-2024-united-states-data-center-energy-usage-report_1.pdf.
Shehabi, A., S. Smith, D. Sartor, R. Brown, M. Herrlin, J. Koomey, E. Masanet, N. Horner, I. Azevedo, and W. Lintner. United States Data Center Energy Usage Report. LBNL-1005775. Lawrence Berkeley National Laboratory, June 2016. https://eta-publications.lbl.gov/sites/default/files/lbnl-1005775_v2.pdf.
Smith, S. J., A. Hubbard, A. Newkirk, M. Ganeshalingam, B. Holecek, D. Sartor, M. Mills, and A. Shehabi. United States Data Center Energy Usage Report: 2025 Update. Lawrence Berkeley National Laboratory, June 2026. https://eta.lbl.gov/publications/united-states-data-center-energy-2025.
U.S. Energy Information Administration. “Data Center Server Energy Use Grows across the Commercial Building Stock.” Today in Energy, May 19, 2026. https://www.eia.gov/todayinenergy/detail.php?id=67704.
U.S. Energy Information Administration. Monthly Energy Review, Table 7.6, “Electricity End Use.” Accessed August 14, 2026. https://www.eia.gov/totalenergy/data/browser/csv.php?tbl=T07.06.
U.S. Environmental Protection Agency, ENERGY STAR Program. Report to Congress on Server and Data Center Energy Efficiency: Public Law 109-431. Prepared by Lawrence Berkeley National Laboratory, LBNL-363E. August 2, 2007. https://www.energystar.gov/ia/partners/prod_development/downloads/EPA_Datacenter_Report_Congress_Final1.pdf.
Electric Power Research Institute. Powering Intelligence 2026: Updated U.S. Data Center Scenarios. February 2026. https://web.archive.org/web/20260305085236id_/https://powering-intelligence.epri.com/assets/executive-summary.html-BgCp-8vK.js.
U.S. Energy Information Administration. Form EIA-861 Instructions, Schedule 4, customer class definitions. 2024. https://www.eia.gov/electricity/data/eia861/zip/f8612024.zip.
U.S. Energy Information Administration. Retail Sales of Electricity by State by Sector. Accessed August 14, 2026. https://www.eia.gov/electricity/data/state/sales_annual.xlsx.
U.S. Energy Information Administration. Sales and Revenue (Form EIA-861M). Accessed August 14, 2026. https://www.eia.gov/electricity/data/eia861m/xls/sales_revenue.xlsx.
Georgia Power. 2023 Integrated Resource Plan Update. Main document. 2023. https://www.georgiapower.com/content/dam/georgia-power/pdfs/company-pdfs/2023-irp-update-main-document.pdf.
Georgia Public Service Commission. Georgia Power 2025 Integrated Resource Plan. Docket No. 56002. 2025. https://psc.ga.gov/search/facts-docket/?docketId=56002.
PJM Interconnection. PJM Long-Term Load Forecast Report. Annual editions, 2021–2026. https://www.pjm.com/planning/resource-adequacy-planning/load-forecast-dev-process.
Fiscal Research Center, Andrew Young School of Policy Studies, Georgia State University. Georgia Tax Expenditure Report for FY 2026. Revised. May 2025. https://opb.georgia.gov/document/tax-expenditure-reports/fy-2026-tax-expenditure-report/download.
Fiscal Research Center, Andrew Young School of Policy Studies, Georgia State University. Georgia Tax Expenditure Report for FY 2027. January 2026. https://opb.georgia.gov/document/tax-expenditure-reports-current-year/fy-2027-tax-expenditure-report/download.
Good Jobs First. Cloudy with a Loss of Spending Control: How Data Centers Are Endangering State Budgets. April 2025. https://goodjobsfirst.org/cloudy-with-a-loss-of-spending-control-how-data-centers-are-endangering-state-budgets/.
Good Jobs First. Data Center Tax Abatements: Why States and Localities Must Disclose These Soaring Revenue Losses. April 2026. https://goodjobsfirst.org/data-center-tax-abatements-why-states-and-localities-must-disclose-these-soaring-revenue-losses/.
Minnesota Department of Revenue. Tax Expenditure Budget: Fiscal Years 2022–2025. 2022. https://www.revenue.state.mn.us/sites/default/files/2022-02/2022%20Tax%20Expenditure%20Budget_0.pdf.
Minnesota Department of Revenue. Tax Expenditure Budget: Fiscal Years 2024–2027. 2024. https://www.revenue.state.mn.us/sites/default/files/2025-01/2024-tax-expenditure-budget-162024-revision.pdf.
National Association of State Budget Officers. 2025 State Expenditure Report: Fiscal Years 2023–2025. January 2026. https://www.nasbo.org/reports-data/state-expenditure-report.
National Conference of State Legislatures. Data Centers: Legislative Trends. Slide presentation. May 2026. https://static.legmt.gov/Divisions/LFD/Committees/MARA/NCSL-Data-Centers-Legislative-Trends-May2026.pdf.
News 5 Cleveland (WEWS). “Calls for Change as Ohio Sales-Tax Break for Data Centers Approaches $1.6 Billion a Year.” May 25, 2026. https://www.news5cleveland.com/news/local-news/oh-cuyahoga/calls-for-change-as-ohio-sales-tax-break-for-data-centers-approaches-1-6-billion-a-year.
Ohio Department of Taxation, Tax Analysis Division. Tax Expenditure Report: Fiscal Years 2026–2027. November 2024. https://archives.obm.ohio.gov/Files/Budget_and_Planning/Operating_Budget/Fiscal_Years_2026-2027/Tax%20Expenditure%20Report%202026-2027.pdf.
Texas Comptroller of Public Accounts. Tax Exemptions and Tax Incidence. Publication 96-463. February 2023. https://comptroller.texas.gov/transparency/reports/tax-exemptions-and-incidence/2023/96-463.pdf.
Texas Comptroller of Public Accounts. Tax Exemptions and Tax Incidence. Publication 96-463. January 2025. https://comptroller.texas.gov/transparency/reports/tax-exemptions-and-incidence/.
U.S. Census Bureau. Annual State Population Estimates (NST-EST2025). 2025. https://www2.census.gov/programs-surveys/popest/datasets/2020-2025/state/totals/NST-EST2025-ALLDATA.csv.
Zuckerman, Jake. “Ohio Data Center Tax Break Cost $1.4 Billion More than Expected in 2025.” Signal Ohio, May 21, 2026. https://signalohio.org/ohio-data-center-tax-break-cost-1-4-billion-more-than-expected-in-2025/.
Data Center Watch. $64 Billion of Data Center Projects Have Been Blocked or Delayed amid Local Opposition. 2025. Accessed August 15, 2026. https://www.datacenterwatch.org/report.
Edison Electric Institute. Large Load Projects and Tariffs. Updated July 17, 2026. https://www.eei.org/-/media/Project/EEI/Documents/Issues%20and%20Policy/List%20of%20Large%20Customer%20Projects%20and%20Tariffs.
Georgia Power. “Georgia Power Highlights First Contracts under New Rules and Regulations, Continued Economic Growth and Updated Forecasts in Latest Filings with Georgia PSC.” Press release, September 30, 2025. https://www.georgiapower.com/news-hub/press-releases/georgia-power-highlights-new-customer-contracts-continued-economic-growth-updated-forecasts-in-latest-filings-with-georgia-psc.html.
National Conference of State Legislatures. Data Centers: Legislative Trends. Slide presentation. May 2026. https://static.legmt.gov/Divisions/LFD/Committees/MARA/NCSL-Data-Centers-Legislative-Trends-May2026.pdf.
Public Utilities Commission of Ohio. “PUCO Orders AEP Ohio to Create Data Center Specific Tariff.” Press release, July 9, 2025. https://puco.ohio.gov/news/puco-orders-aep-ohio-to-create-data-center-specific-tariff.
U.S. Energy Information Administration. Form EIA-861 Instructions, Schedule 4, customer class definitions. 2024. https://www.eia.gov/electricity/data/eia861/zip/f8612024.zip.
Virginia State Corporation Commission. SCC Data Center Initiatives: Ensuring Data Centers Pay Their Own Costs. Fact sheet. February 2026. https://www.scc.virginia.gov/media/sccvirginiagov-home/about-the-scc/fact-sheets/scc-data-center-initiatives-02-2026.pdf.