
Policy Memo
Topline
Abundant, affordable, and reliable energy is the foundation of modern prosperity, and American demand for it is set to climb as data centers, advanced manufacturing, and even more electrification come online.
This paper asks a simple question: If the United States were to cut its carbon-dioxide emissions, how much would global temperatures actually change? Using the Model for the Assessment of Greenhouse Gas Induced Climate Change (MAGICC), we remove fossil-fuel carbon dioxide from a standard emissions scenario, first for the whole country and then one state at a time, under assumptions chosen to make the temperature savings as large as possible. Eliminating all U.S. energy-related fossil-fuel carbon dioxide lowers projected warming by about 0.24 degrees Celsius in 2100, and no individual state reaches even 0.031 degrees. The result does not depend on any contested piece of climate science; it follows from a single country's small share of a global total. Because the climate benefit of unilateral carbon reduction is so small while its costs to energy affordability and reliability are real, policy should favor energy abundance over energy restriction.
Nearly every advance in modern living standards rests on a single foundation: access to abundant, affordable, and reliable energy. In a recent data-driven analysis, we documented this relationship across the entire historical record and around the world, showing that higher energy use goes hand in hand with higher incomes, greater productivity, larger agricultural output, and better public health (Dayaratna & Miller, 2026). Energy is not incidental to these gains. It powers the factories, hospitals, water systems, and computers on which a modern economy runs, and it raises the output that a given amount of labor and capital can produce (Smil, 2017; Dayaratna et al., 2023). This paper builds directly on that work, turning from the benefits of energy abundance to the costs of restricting it.
Because energy is bound so tightly to human welfare, policies that restrict its supply or raise its price carry real costs. The usual justification for accepting those costs is climate change. The argument is familiar: the United States is a large economy and a large emitter, so it should cut its use of fossil fuels to hold down future warming. This paper does not dispute that a warming climate is worth taking seriously. It asks a narrower and more answerable question: If the United States reduced its carbon-dioxide emissions, how much would global temperatures actually change?
The answer, as we show below, is very little. Climate impacts are trifling even when the entire country is decarbonized, and they become virtually nothing when the policy is implemented on a state-by-state basis. This conclusion does not depend on any particular reading of climate science; it follows from assuming the more dire assumptions about climate change by climate alarmists. Moreover, the finding rests on basic arithmetic. No single country, let alone a single state, is responsible for more than a small share of global emissions.
Let’s start with what energy delivers. Across the entire historical record, higher energy consumption tracks closely with higher per capita income, greater labor productivity, larger agricultural output, and better public health, and it does so at every stage of development (Dayaratna & Miller, 2026). The relationship runs in both directions: energy access raises incomes, and rising incomes finance still more energy use (Kraft & Kraft, 1978; Ozturk, 2010).
For public health the connection is not merely statistical; it is physical. Hospitals need reliable electricity for surgical lighting, sterilization, refrigerated vaccines, diagnostic imaging, and life support. Clean water and wastewater treatment depend on energy for pumping, filtration, and treatment. As energy use has spread across the globe, global life expectancy has more than doubled, from about 32 years in 1900 to more than 73 years today, and child mortality has fallen from nearly 25 percent in 1950 to under 4 percent (World Health Organization, 2025; Dayaratna et al., 2023).
American demand for energy is now set to rise after two decades of flat consumption. Artificial intelligence data centers, advanced manufacturing, and the electrification of transportation and heating are driving sustained new demand. The International Energy Agency projects U.S. electricity demand growing by about 2 percent per year through 2030, with about half of that growth coming from data centers alone (International Energy Agency, 2026). The artificial intelligence boom in particular is running up against a grid that regulation has left unprepared to expand (Dayaratna, 2026). Policies that constrict supply run headlong into that reality. That is precisely why the climate case for restricting American energy deserves a hard look, and why the size of the temperature benefit is the number that matters.
To measure the temperature effect of cutting U.S. emissions, we use the Model for the Assessment of Greenhouse Gas Induced Climate Change (MAGICC), version 6. MAGICC is a well-established reduced-form climate model that reproduces the behavior of the far more complex models used by the Intergovernmental Panel on Climate Change (IPCC), and it is built for exactly this kind of scenario comparison (Meinshausen et al., 2011). The model, the governing equations, and our treatment of U.S. emissions are described in the Appendix.
Our procedure is straightforward. We first run a baseline using Representative Concentration Pathway 6.0 (RCP6), a standard scenario supplied with the model. We then remove the fossil-fuel carbon dioxide attributable to a given jurisdiction, beginning in 2020, and run the model again. The gap between the two temperature paths is the warming that jurisdiction's emissions would have caused. State emissions shares come from the Energy Information Administration's State Energy Data System, which reports energy-related carbon dioxide by state through 2022 (U.S. Energy Information Administration, 2024).
We chose our key assumptions to overstate, not understate, the benefit of cutting emissions. Our simulated emissions cuts begin in 2020 and are treated as permanent. Additionally, we set the equilibrium climate sensitivity to 5 degrees Celsius, at the top of the plausible range. The Intergovernmental Panel on Climate Change puts the best estimate at 3 degrees Celsius and the very likely range at 2 to 5 degrees (Intergovernmental Panel on Climate Change, 2021), so our value sits at the upper bound of what the mainstream literature considers credible. A higher sensitivity produces a larger temperature response to any given emissions cut. If domestic carbon reductions look trivial under these generous assumptions, then they will look smaller still under more realistic ones.
The aggregate result is quite trifling. Eliminating all energy-related fossil-fuel carbon dioxide in the United States, starting in 2020 and sustained thereafter, lowers projected global warming by about 0.11 degrees Celsius in 2050 and about 0.24 degrees Celsius in 2100 (a figure we round upward here to avoid any risk of understating the effect). To put that in perspective, RCP6 projects about 4.62 degrees of warming by 2100 at the sensitivity we used, so zeroing out the entire country removes only about 5 percent of it. This squares with earlier work finding that decarbonization limited to advanced economies would shave no more than a few tenths of a degree off end-of-century warming (Dayaratna, 2025; Dayaratna & Loris, 2019).
The comparison is easiest to grasp in a picture. Figure 1 sets the warming contribution of Texas, the largest-emitting state, and of the entire United States alongside the total warming the model still projects between today and 2100. It shows each at both ends of the range of climate sensitivities the Intergovernmental Panel on Climate Change considers plausible, the very likely range of 2 to 5 degrees Celsius around its best estimate of 3 (Intergovernmental Panel on Climate Change, 2021).
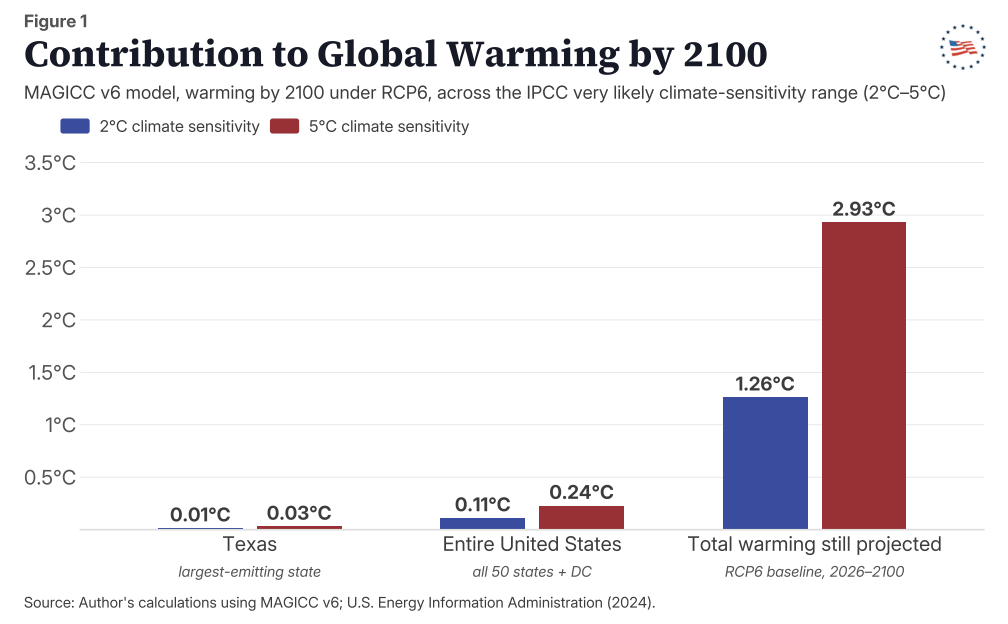
The result holds across that range. At the higher, 5-degree sensitivity, eliminating every ton of U.S. fossil-fuel carbon dioxide removes about 0.24 degrees Celsius by 2100, against about 2.9 degrees of warming still to come, a contribution of about 8 percent. At the more mainstream 2-degree sensitivity the absolute figures are cut nearly in half, to about 0.11 and 1.3 degrees, yet that 8 percent share barely moves, because a jurisdiction's contribution and the total projected warming scale together. Whichever sensitivity one adopts, the entire United States is a small share of the problem, and Texas by itself is a rounding error.
The point becomes clearer still one state at a time. Figure 2 shows the warming avoided by removing each state's fossil-fuel carbon dioxide, ranked from the largest emitter to the smallest; the complete list of all fifty states and the District of Columbia also appears in Appendix B.
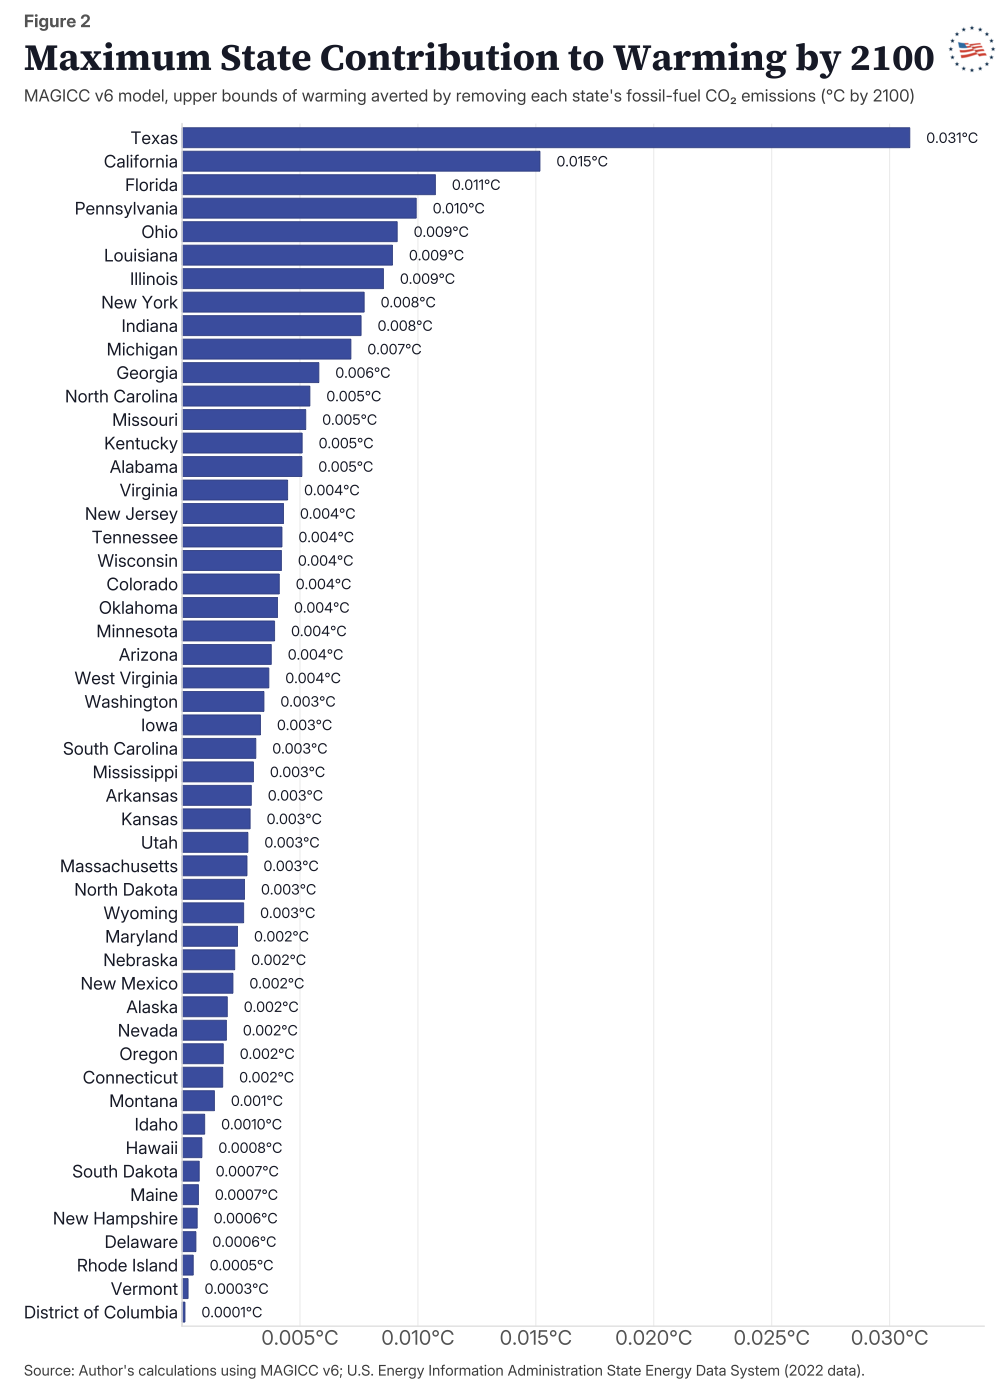
As Figure 2 shows, Texas, which produces about 13 percent of the nation's energy-related carbon dioxide, accounts for about 0.031 degrees Celsius of avoided warming by 2100. California and Florida, the next largest, come in near 0.015 and 0.011 degrees. At the bottom of the list, the District of Columbia, Vermont, and Rhode Island each register a few ten-thousandths of a degree. The median state avoids about 0.003 degrees by 2100, and forty-eight of the fifty-one jurisdictions fall below 0.01 degrees. These are not simply small numbers in a policy sense. They are far below anything an instrument could ever distinguish from the natural year-to-year variability of the climate.
If the domestic numbers settle the question, the international picture makes it decisive. The emissions that drive global temperatures are increasingly concentrated abroad, and still climbing. Figure 3 sets China's energy-related carbon dioxide against that of the United States and its two largest-emitting states.
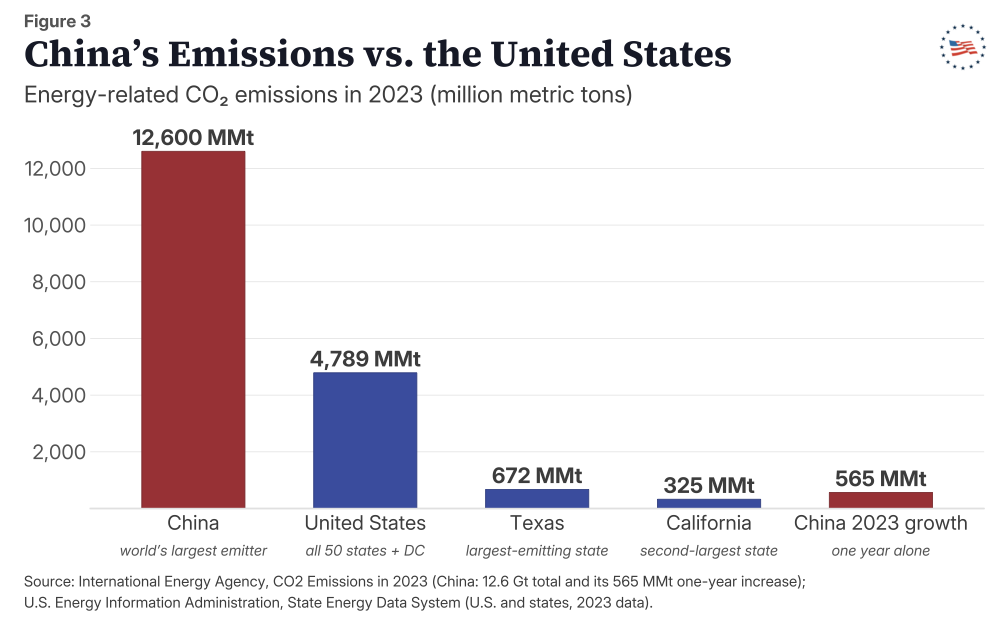
China alone emitted about 12.6 billion metric tons of energy-related carbon dioxide in 2023, more than two and a half times the entire United States and about nineteen times the output of Texas (International Energy Agency, 2024; U.S. Energy Information Administration, 2024). Its emissions grew by 565 million metric tons in that single year, an increase larger than the total annual output of any American state other than Texas, and close to Texas's entire footprint. The emissions China adds in a single year, in other words, rival what the largest American state emits in total. Against that arithmetic, no single state's reductions, and no realistic combination of them, can register in the global climate.
The conclusion does not hinge on the climate sensitivity, the choice of scenario, or any disputed point of climate science. It rests on something simpler. Global temperature responds to global emissions, and any one country, let alone any one state, controls only a fraction of the total. Run that fraction through a mainstream climate model with the assumptions tilted toward a large effect, and the temperature change is still too small to matter. A reader deeply worried about warming and a reader skeptical of it can agree on the policy point: cutting emissions in the United States alone buys no meaningful climate benefit.
Two conclusions follow, and they point the same way. First, if the climate benefit of unilateral carbon reduction is negligible, then the costs of these policies deserve the scrutiny they are too often spared. Restricting energy or driving up its price reduces productivity, slows income growth, and narrows access to essential services, and those burdens land hardest on lower-income households and energy-poor regions (Dayaratna & Miller, 2026). When the climate benefit on the other side of the ledger is a few hundredths of a degree, the case for accepting those burdens collapses on its own terms.
Second, policy should be targeted toward achieving energy abundance, not energy restriction. A genuine all-of-the-above approach, one that lets energy sources compete on cost and reliability rather than on political favor, would expand supply and meet the demand now arriving from data centers, advanced manufacturing, and electrification. Where subsidies tilt investment toward favored technologies, they should be reconsidered; where permitting delays block generation and transmission that the market would otherwise build, reform is overdue (Dayaratna & Loris, 2019).
None of these considerations requires settling the larger debate over climate change. Instead, it requires only recognizing that the lever in question, cutting U.S. emissions, does not meaningfully impact the climate. This is especially worth remembering at the state level. A legislator weighing a carbon mandate, a low-carbon fuel standard, or a power-plant rule is being asked to impose real and immediate costs on his constituents in exchange for a change in global temperature that is, quite literally, too small to measure.
Abundant, affordable, and reliable energy is the foundation of modern prosperity, and the coming decade will call for more of it, not less. The most common argument for restricting America's energy supply is climate change; however, the climate return on that restriction is negligible. Eliminating every ton of energy-related fossil-fuel carbon dioxide in the United States would lower global warming by no more than 0.24 degrees Celsius by 2100, and that figure is generous by design; the contribution of any single state is a small fraction of even that. Whatever one's view of climate change, carbon-reduction policy confined to the United States, and still more to a single state, will not meaningfully change global temperatures. Policymakers, and state lawmakers in particular, should weigh their energy decisions accordingly.
Dayaratna, K. D. (2025, April 2). Statement of Kevin D. Dayaratna, Ph.D., before the Subcommittee on Oversight and Investigations, Committee on Natural Resources, U.S. House of Representatives, on “Unleashing the golden age of American energy dominance.” 119th Cong., 1st sess. https://www.congress.gov/119/meeting/house/118088/witnesses/HHRG-119-II15-Wstate-DayaratnaK-20250402.pdf
Dayaratna, K. D. (2026, June 1). AI runs on electricity, but Washington is blocking the grid. National Review. https://www.nationalreview.com/2026/06/ai-runs-on-electricity-but-washington-is-blocking-the-grid/
Dayaratna, K. D., Kreutzer, D., Loris, N. D., & Van Doren, T. (2023). Powering human advancement: Why the world needs affordable and reliable energy. The Heritage Foundation. https://www.heritage.org/energy/report/powering-human-advancement-why-the-world-needs-affordable-and-reliable-energy
Dayaratna, K. D., & Loris, N. D. (2019, July 24). Assessing the costs and benefits of the Green New Deal’s energy policies (Backgrounder No. 3427). The Heritage Foundation. https://www.heritage.org/energy-economics/report/assessing-the-costs-and-benefits-the-green-new-deals-energy-policies
Dayaratna, K. D., & Miller, K. (2026, May 28). Energy abundance and human flourishing: A data-driven global analysis. Advancing American Freedom. https://advancingamericanfreedom.com/memos/energy-abundance-and-human-flourishing-a-data-driven-global-analysis
Gieseke, R., Willner, S. N., & Mengel, M. (2018). Pymagicc: A Python wrapper for the simple climate model MAGICC. Journal of Open Source Software, 3(22), 516. https://doi.org/10.21105/joss.00516
Intergovernmental Panel on Climate Change. (2014). Climate change 2013: The physical science basis. Contribution of Working Group I to the Fifth Assessment Report of the Intergovernmental Panel on Climate Change (T. F. Stocker et al., Eds.). Cambridge University Press.
Intergovernmental Panel on Climate Change. (2021). Climate change 2021: The physical science basis. Contribution of Working Group I to the Sixth Assessment Report of the Intergovernmental Panel on Climate Change (V. Masson-Delmotte et al., Eds.). Cambridge University Press. https://doi.org/10.1017/9781009157896
International Energy Agency. (2024). CO2 emissions in 2023. https://www.iea.org/reports/co2-emissions-in-2023
International Energy Agency. (2026). Electricity 2026. https://www.iea.org/reports/electricity-2026
Kraft, J., & Kraft, A. (1978). On the relationship between energy and GNP. Journal of Energy and Development, 3(2), 401–403. https://www.jstor.org/stable/24806805
Meinshausen, M., Raper, S. C. B., & Wigley, T. M. L. (2011). Emulating coupled atmosphere-ocean and carbon cycle models with a simpler model, MAGICC6: Part 1, Model description and calibration. Atmospheric Chemistry and Physics, 11(4), 1417–1456. https://doi.org/10.5194/acp-11-1417-2011
Ozturk, I. (2010). A literature survey on energy-growth nexus. Energy Policy, 38(1), 340–349. https://doi.org/10.1016/j.enpol.2009.09.024
Smil, V. (2017). Energy and civilization: A history. MIT Press.
U.S. Energy Information Administration. (2024). Energy-related carbon dioxide emissions by state, 1970–2022. https://www.eia.gov/environment/emissions/state/
U.S. Environmental Protection Agency. (2025). Global greenhouse gas emissions data. https://www.epa.gov/ghgemissions/global-greenhouse-gas-emissions-data
World Health Organization. (2025, December 16). Household air pollution. https://www.who.int/news-room/fact-sheets/detail/household-air-pollution-and-health
The analysis in this paper uses the Model for the Assessment of Greenhouse Gas Induced Climate Change (MAGICC), version 6. MAGICC is a reduced-form climate model that emulates the atmosphere-ocean and carbon-cycle behavior of the large general circulation models assessed by the IPCC at a small fraction of their computational cost (Meinshausen et al., 2011). It represents the climate as an energy balance, in which a change in the radiative forcing at the top of the troposphere is split between additional outgoing energy and heat taken up by the ocean.
Let Q(t) denote the global-mean radiative forcing at time t, ΔT(t) the resulting surface-temperature change, and N(t) the rate at which the climate system, mainly the ocean, takes up heat. The energy balance is
Q(t) = λ · ΔT(t) + N(t)
where λ is the climate feedback parameter that relates the outgoing energy flux to the surface-temperature change. The equilibrium climate sensitivity, the eventual warming from a doubling of carbon dioxide, follows from setting the ocean heat uptake to zero at equilibrium:
ΔT2x = Q2x / λ
where the forcing term in the numerator is the radiative forcing from doubled carbon dioxide. A larger sensitivity corresponds to a smaller feedback parameter, so a given emissions change produces a larger temperature response. Combining the two relationships gives the time-dependent, or effective, sensitivity,
Seff(t) = Q2x · ΔT(t) / [ Q(t) - N(t) ]
which returns to the equilibrium value once the system reaches steady state. MAGICC couples this energy balance to a carbon-cycle module with temperature feedbacks and takes an emissions trajectory as an input. For that trajectory we use Representative Concentration Pathway 6.0 (RCP6), a reference scenario supplied with the model and specified in the IPCC's Fifth Assessment Report (Intergovernmental Panel on Climate Change, 2014).
To isolate the effect of U.S. emissions, we modify the reference scenario. Emissions data from the Environmental Protection Agency indicate that the United States accounts for approximately 43 percent of energy-related carbon dioxide among the member nations of the Organization for Economic Co-operation and Development (OECD), and we hold that share constant over the projection period (U.S. Environmental Protection Agency, 2025). Within RCP6 we adjust the OECD trajectory to reflect removing the U.S. portion beginning in 2020. Because we treat the reductions as immediate and permanent, our procedure overstates the temperature effect of any realistic policy.
We then extend this approach from the country to the individual state. We take each state's share of national energy-related carbon dioxide from the Energy Information Administration's State Energy Data System for 2022 (U.S. Energy Information Administration, 2024), and we obtain its share of the OECD reduction by multiplying that state share by the U.S. share of the OECD total. Removing that portion from RCP6 and running the model yields an altered temperature path; the difference from the baseline in 2050 and 2100 is the warming avoided by eliminating that state's fossil-fuel carbon dioxide. Every simulation uses an equilibrium climate sensitivity of 5 degrees Celsius, near the upper end of the credible range and chosen, as noted above, so that our estimated temperature savings are larger than they would be under more conventional assumptions.
The MAGICC6 model remains publicly available for replication even though its original download page has been retired in favor of the newer MAGICC7. A complete, unmodified MAGICC6 distribution, including the executable and the RCP scenario files used here, is bundled with the open-source pymagicc package (Gieseke et al., 2018).
Table B1. Global mean warming avoided by eliminating each jurisdiction's energy-related fossil-fuel carbon dioxide, beginning in 2020. RCP6 reference scenario; climate sensitivity of 5 degrees Celsius.
| Jurisdiction | Share of U.S. CO2Share | Avoided warming 2050 (°C)2050 (°C) | Avoided warming 2100 (°C)2100 (°C) |
|---|---|---|---|
| Alabama | 2.21% | 0.0024 | 0.0051 |
| Alaska | 0.84% | 0.0009 | 0.0019 |
| Arizona | 1.65% | 0.0018 | 0.0038 |
| Arkansas | 1.28% | 0.0014 | 0.0029 |
| California | 6.61% | 0.0072 | 0.0152 |
| Colorado | 1.80% | 0.0020 | 0.0041 |
| Connecticut | 0.75% | 0.0008 | 0.0017 |
| Delaware | 0.26% | 0.0003 | 0.0006 |
| District of Columbia | 0.05% | 0.0001 | 0.0001 |
| Florida | 4.68% | 0.0051 | 0.0107 |
| Georgia | 2.53% | 0.0028 | 0.0058 |
| Hawaii | 0.37% | 0.0004 | 0.0008 |
| Idaho | 0.42% | 0.0005 | 0.0010 |
| Illinois | 3.72% | 0.0041 | 0.0085 |
| Indiana | 3.31% | 0.0036 | 0.0076 |
| Iowa | 1.45% | 0.0016 | 0.0033 |
| Kansas | 1.26% | 0.0014 | 0.0029 |
| Kentucky | 2.22% | 0.0024 | 0.0051 |
| Louisiana | 3.89% | 0.0042 | 0.0089 |
| Maine | 0.30% | 0.0003 | 0.0007 |
| Maryland | 1.02% | 0.0011 | 0.0024 |
| Massachusetts | 1.20% | 0.0013 | 0.0028 |
| Michigan | 3.12% | 0.0034 | 0.0072 |
| Minnesota | 1.71% | 0.0019 | 0.0039 |
| Mississippi | 1.32% | 0.0014 | 0.0030 |
| Missouri | 2.29% | 0.0025 | 0.0052 |
| Montana | 0.60% | 0.0007 | 0.0014 |
| Nebraska | 0.97% | 0.0011 | 0.0022 |
| Nevada | 0.82% | 0.0009 | 0.0019 |
| New Hampshire | 0.28% | 0.0003 | 0.0006 |
| New Jersey | 1.87% | 0.0020 | 0.0043 |
| New Mexico | 0.94% | 0.0010 | 0.0022 |
| New York | 3.37% | 0.0037 | 0.0077 |
| North Carolina | 2.36% | 0.0026 | 0.0054 |
| North Dakota | 1.16% | 0.0013 | 0.0026 |
| Ohio | 3.98% | 0.0043 | 0.0091 |
| Oklahoma | 1.76% | 0.0019 | 0.0040 |
| Oregon | 0.76% | 0.0008 | 0.0017 |
| Pennsylvania | 4.33% | 0.0047 | 0.0099 |
| Rhode Island | 0.21% | 0.0002 | 0.0005 |
| South Carolina | 1.36% | 0.0015 | 0.0031 |
| South Dakota | 0.32% | 0.0003 | 0.0007 |
| Tennessee | 1.85% | 0.0020 | 0.0042 |
| Texas | 13.44% | 0.0146 | 0.0309 |
| Utah | 1.22% | 0.0013 | 0.0028 |
| Vermont | 0.11% | 0.0001 | 0.0003 |
| Virginia | 1.95% | 0.0021 | 0.0045 |
| Washington | 1.51% | 0.0016 | 0.0035 |
| West Virginia | 1.60% | 0.0017 | 0.0037 |
| Wisconsin | 1.84% | 0.0020 | 0.0042 |
| Wyoming | 1.14% | 0.0012 | 0.0026 |
| United States (sum of states) | 100.00% | 0.1089 | 0.2294 |
Meinshausen, M., Raper, S. C. B., & Wigley, T. M. L. (2011). Emulating coupled atmosphere-ocean and carbon cycle models with a simpler model, MAGICC6: Part 1, Model description and calibration. Atmospheric Chemistry and Physics, 11(4), 1417–1456. https://doi.org/10.5194/acp-11-1417-2011
U.S. Energy Information Administration. (2024). Energy-related carbon dioxide emissions by state, 1970–2022. https://www.eia.gov/environment/emissions/state/
Meinshausen, M., Raper, S. C. B., & Wigley, T. M. L. (2011). Emulating coupled atmosphere-ocean and carbon cycle models with a simpler model, MAGICC6: Part 1, Model description and calibration. Atmospheric Chemistry and Physics, 11(4), 1417–1456. https://doi.org/10.5194/acp-11-1417-2011
U.S. Energy Information Administration. (2024). Energy-related carbon dioxide emissions by state, 1970–2022. https://www.eia.gov/environment/emissions/state/
International Energy Agency. (2024). CO2 emissions in 2023. https://www.iea.org/reports/co2-emissions-in-2023
Meinshausen, M., Raper, S. C. B., & Wigley, T. M. L. (2011). Emulating coupled atmosphere-ocean and carbon cycle models with a simpler model, MAGICC6: Part 1, Model description and calibration. Atmospheric Chemistry and Physics, 11(4), 1417–1456. https://doi.org/10.5194/acp-11-1417-2011
U.S. Energy Information Administration. (2024). Energy-related carbon dioxide emissions by state, 1970–2022. https://www.eia.gov/environment/emissions/state/