
Policy Memo
Topline
The social cost of carbon, the dollar figure used to justify more than a decade of federal energy and environmental regulation, is not a robust statistical tool, because reasonable, well-supported changes to a handful of assumptions swing the estimate by
The social cost of carbon (SCC) assigns a dollar value to the purported damage caused by an additional ton of carbon-dioxide emissions and has served for more than a decade as a central justification for federal energy and environmental regulation. This policy paper examines the integrated assessment models used to generate the SCC across the Obama, Trump, and Biden administrations and shows that their estimates are not robust. Four assumptions govern the result: the discount rate, the time horizon, the equilibrium climate sensitivity distribution, and agricultural productivity. Peer-reviewed research demonstrates that reasonable, well-supported changes to any one of them can cut the SCC by more than half, and that a combination of defensible choices can drive the estimate below zero, implying, if taken literally, that carbon dioxide should be subsidized rather than taxed. That a single metric can be made to support both an aggressive carbon tax and a carbon subsidy demonstrates how readily the number can be manipulated. The paper concludes that federal and state policymakers should decline to rely on the SCC in regulatory decisions and should consider prohibiting any regulatory use of the metric by statute.
For the better part of two decades, one number has quietly underwritten a sprawling body of federal energy and environmental regulation: the social cost of carbon. The SCC purports to measure the economic damage, in dollars, associated with emitting one additional metric ton of carbon dioxide, tallied across a time horizon that stretches 300 years into the future (Interagency Working Group on the Social Cost of Carbon, 2010). Because that single figure can be dropped into the cost-benefit analysis behind almost any rule that touches energy, the number has been used to justify regulations on everything from automobiles and power plants to household lamps, furnaces, and even pool-pump motors.
The SCC is generated by a class of tools called integrated assessment models (IAMs), which couple a simplified model of the global economy to a simplified model of the climate, run the pair forward for centuries, and estimate the incremental damage of an additional pulse of emissions. Because many of the inputs are uncertain, the models are run thousands of times over, typically across 10,000 Monte Carlo iterations, to produce a probability distribution rather than a single number, summarized by a mean or median. On paper this is a reasonable exercise: cutting emissions is, at bottom, an investment decision, and any investment should be judged against its expected return. The ambition of the exercise is not the problem; the fragility of the result is. Over more than a decade, a series of peer-reviewed and published studies has shown that the SCC is simply not robust (Dayaratna & Kreutzer, 2013, 2014; Dayaratna et al., 2017, 2020). A metric that can be adjusted to yield almost any result cannot serve as an objective measure of damage. This policy paper surveys the assumptions on which the SCC depends and the reasons no number this pliable belongs at the center of binding regulation.
The SCC’s regulatory career maps neatly onto changes in administration. The Obama administration formalized the metric and appointed an Interagency Working Group, drawing together the EPA, the Department of Energy, the Council of Economic Advisers, and others. The Working Group adopted three IAMs, known as DICE, FUND, and PAGE, and estimated the SCC in the range of approximately $26 to $95 per ton for emissions in 2050 (Interagency Working Group on Social Cost of Greenhouse Gases, 2016). Those figures became a standing justification for regulating carbon across the economy. Notably, the Working Group declined to follow the Office of Management and Budget’s own guidance requiring that a 7 percent discount rate be reported (Office of Management and Budget, 2003).
The first Trump administration disbanded the Working Group, refocused the analysis on damages actually accruing within the United States, and applied more defensible discount rates; the reported SCC fell to low single digits per ton. The Biden administration then resurrected the SCC on its first day and went further, replacing the older models with three new ones: the Greenhouse Gas Impact Value Estimator (GIVE), the Data-driven Spatial Climate Impact Model (DSCIM), and the Howard and Sterner meta-analysis models. By centering the analysis on an unusually low 2 percent discount rate and other aggressive assumptions, the EPA drove the SCC up to a range of approximately $260 to $650 per ton for emissions in 2080, an enormous increase used to justify a wave of new rules (U.S. Environmental Protection Agency, 2023; Frei et al., 2025).
Across every one of these models, old and new, Obama-era and Biden-era, the same vulnerability recurs. The estimates are highly sensitive to a small number of assumptions, four of which do the work: the discount rate, the time horizon, the equilibrium climate sensitivity distribution, and agricultural productivity (Frei et al., 2025; Gae & Dayaratna, 2025). Because these inputs are matters of judgment rather than settled fact, whoever runs the model effectively chooses the answer in advance. Each assumption is worth examining in turn.
Discounting is frequently misunderstood as a matter of valuing future dollars less than present ones, an interpretation that invites the objection that the practice neglects the welfare of future generations. The sounder way to understand discounting is as an investment decision (Kreutzer, 2024). Cutting carbon-dioxide emissions is an investment in environmental capital: resources committed today to improve the flow of environmental services in the future. Those same resources, however, could be invested in human or physical capital, which would also benefit future generations, and the resources available for any of these investments are limited. Reducing emissions is therefore worthwhile only to the extent that the investment earns a return at least as large as the best available alternative, and discounting is the mechanism for making that comparison. Setting the discount rate too low does not protect future generations; the practice harms them, by directing resources into emission cuts that return less than other investments would have. From 2003 through 2023, the Office of Management and Budget’s Circular A-4 required agencies to run cost-benefit analyses at both 3 percent and 7 percent, the latter reflecting the real return on private capital, which has averaged approximately 7 percent over the past two centuries. The Obama Working Group simply ignored the 7 percent rate, and the Biden EPA went further in the opposite direction, replacing deterministic discounting with a Ramsey scheme centered on rates as low as 2 percent, a change that raises rather than lowers the weight placed on speculative far-future damages (Office of Management and Budget, 2003; U.S. Environmental Protection Agency, 2023).
The consequences are dramatic. Figure 1 presents the GIVE model’s mean estimate for 2080 emissions under a range of deterministic discount rates, holding every other assumption fixed.
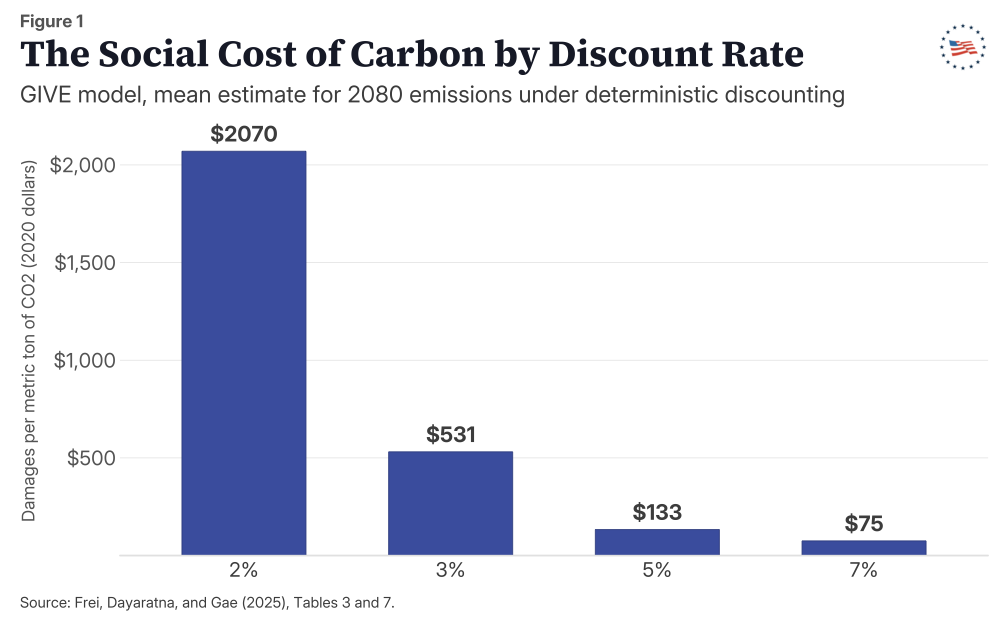
As Figure 1 shows, the estimate falls from $2,070 per ton at a 2 percent rate to $531 at 3 percent, $133 at 5 percent, and just $75 at the 7 percent rate OMB had long required, a swing of more than an order of magnitude driven by nothing more than the choice of rate. The Biden EPA’s Ramsey approach sidestepped that discipline: that same $75 figure sits approximately 70 percent below the $257 the Biden EPA reported at its 2.5 percent Ramsey rate (Frei et al., 2025). No new science justified any of these changes.
The SCC sums damages over 300 years. Consider what that means. When George Washington took office, no one could have foreseen the automobile, antibiotics, the semiconductor, or artificial intelligence, and forecasters today are in no better position to project the technology, wealth, or emissions of the twenty-fourth century. Yet the models confidently assign dollar damages that far out and fold them into today’s regulatory ledger, and they are structured so that the largest purported damages arrive deep in that window, which mechanically ratchets up the reported number. The Biden EPA’s Data-driven Spatial Climate Impact Model (DSCIM) makes the point especially vividly. Figure 2 presents the effect of shortening this window in DSCIM, comparing the model’s 2080 estimate over the full 300-year horizon with the same estimate truncated to a still-generous 150 years.
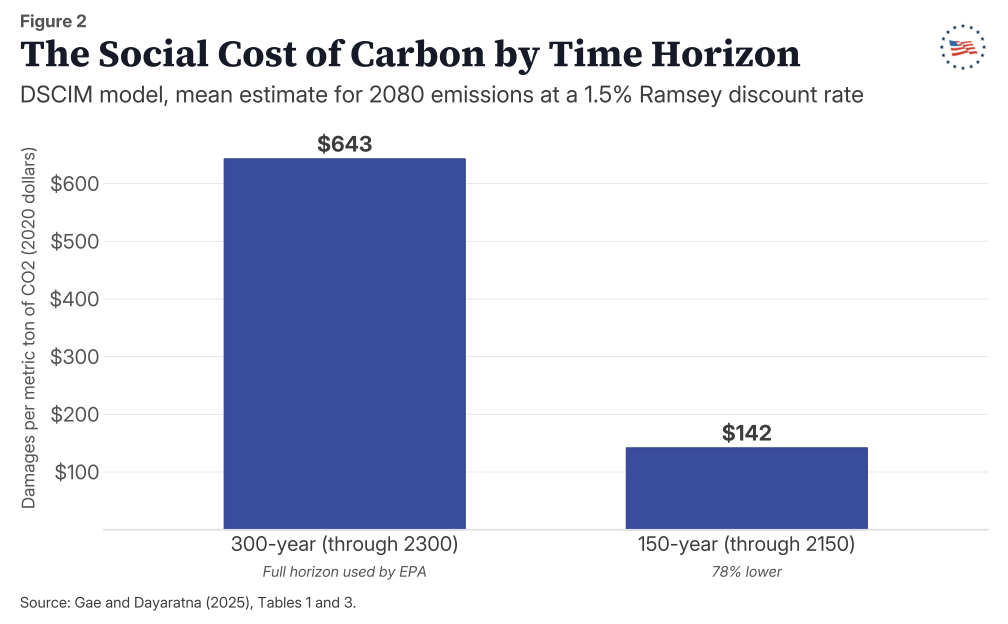
As Figure 2 demonstrates, at a 1.5 percent Ramsey discount rate the mean 2080 estimate falls from $643 per ton to $142, a reduction of 78 percent, purely from declining to project damages beyond 2150. The same truncation lowers DSCIM’s estimate by well over half at every discount rate the Biden EPA used (Gae & Dayaratna, 2025). More than half of the “damage” the model reports therefore comes from projecting the economy and climate 150 to 300 years into the future, precisely the region where any honest forecaster would concede to knowing essentially nothing.
Equilibrium climate sensitivity (ECS) is the amount of eventual warming from a doubling of atmospheric carbon dioxide. That warming occurs is not in dispute; how much occurs is. Rather than a single number, the IAMs draw ECS from an entire probability distribution, and the choice of distribution matters enormously, because these distributions carry a long right tail. A handful of low-probability, high-warming draws generate the catastrophic damages that inflate the mean SCC. This is why, in the GIVE model, the mean routinely sits well above the median: a few extreme scenarios do the pulling. For years the government relied on the model-simulated Roe-Baker distribution, with a fat tail. Observation-based estimates, however, now exist. In peer-reviewed work, Dayaratna, McKitrick, and Kreutzer (2017) substituted the empirically grounded Lewis-Curry distribution for Roe-Baker and found that the mean SCC fell by approximately 30 to 50 percent in the DICE model and by more than 80 percent in the FUND approximately. In FUND, the probability that carbon dioxide is actually a negative externality, that the SCC is below zero, rose from about 10 percent to approximately 40 percent.
DSCIM proves just as sensitive to this assumption. Figure 3 presents the model’s 2080 estimate under three climate-sensitivity distributions: the EPA’s own model-simulated assumption and two observation-based alternatives drawn from the peer-reviewed literature.
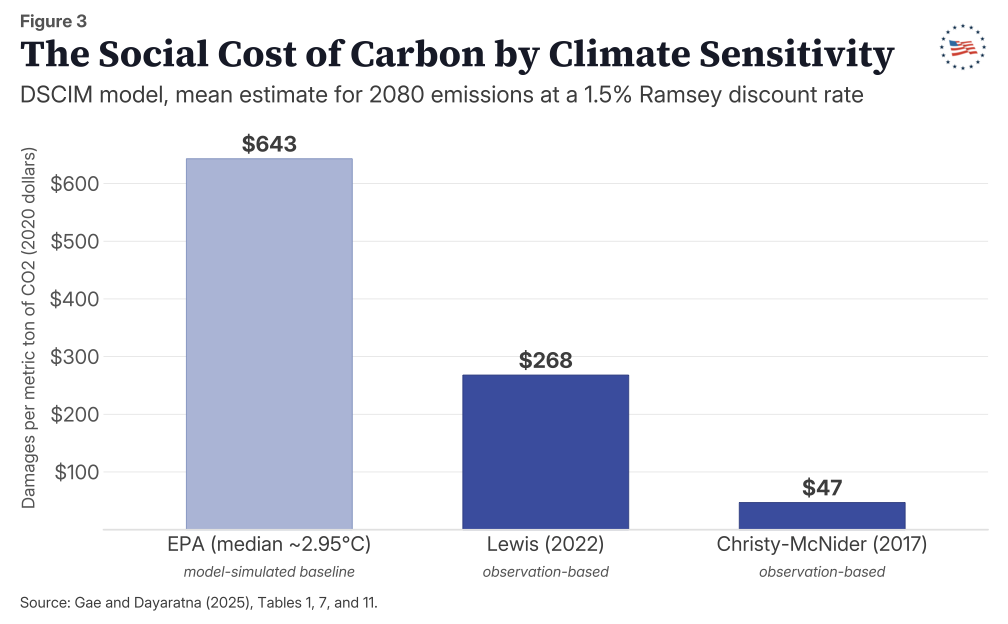
As Figure 3 shows, holding the model, the year, and the discount rate fixed and changing only the climate-sensitivity distribution, the mean estimate falls from $643 per ton under the EPA’s assumption to $268 under the distribution of Lewis (2022) and just $47 under that of Christy and McNider (2017), a reduction of approximately 93 percent (Gae & Dayaratna, 2025; see also Christy & McNider, 2017). Once the model is disciplined by observations rather than simulations, nearly all of the alleged damage evaporates.
Finally, there is the treatment of carbon dioxide itself. CO₂ is not merely a byproduct of combustion; the gas is a fundamental input to photosynthesis, and rising concentrations lengthen growing seasons and raise crop yields. Satellite records document a measurably greening planet, and the agronomic literature confirms the corresponding gains in agricultural output (Zhu et al., 2016; Challinor et al., 2014). Integrated assessment models handle this benefit inconsistently: the Obama-era DICE model does not permit carbon dioxide to generate any net benefit at all, while FUND and GIVE include the fertilization effect at too small a magnitude. In later peer-reviewed work, Dayaratna, McKitrick, and Michaels (2020) updated FUND’s CO₂-fertilization parameter, raising the value by approximately 30 percent to match the satellite and experimental evidence. Combined with an empirically based climate-sensitivity distribution and reasonable discount rates as low as 2.5 percent, that single correction drives the FUND estimate to essentially zero, with a substantial probability of falling below zero, through the middle of this century.
The four assumptions examined above are usually considered one at a time; in the real world they compound. Because the FUND and GIVE models permit the social cost of carbon to fall below zero, adopting a set of assumptions no less defensible than the government’s own, namely an observation-based climate-sensitivity distribution, the corrected CO₂-fertilization effect described earlier, a shorter time horizon, and a market-based discount rate, does not merely shrink the estimate; the combination drives the estimate below zero. The choice of climate-sensitivity distribution alone is enough to illustrate the point. Figure 4 presents the probability, in the FUND model, that carbon dioxide is a net benefit rather than a net cost.
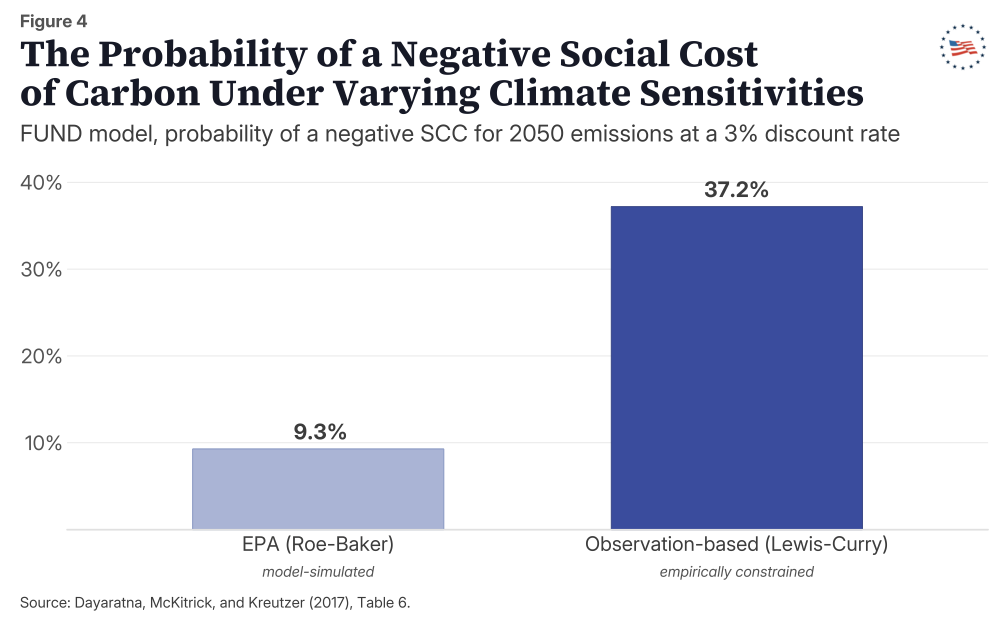
As Figure 4 shows, replacing the EPA’s model-simulated climate-sensitivity distribution with an observation-based one raises that probability from 9.3 percent to 37.2 percent for mid-century (2050) emissions. Layering in the corrected agricultural response described earlier lowers the central estimate itself below zero over the same period (Dayaratna et al., 2017, 2020).
The implication for regulation follows directly. If the social cost of carbon is negative, then the government’s own logic runs in reverse: carbon dioxide should not be taxed at all; emissions should be subsidized. This fact is not an argument that carbon dioxide should be subsidized, or that Washington should pay anyone to emit the gas. However, when a single metric can be marshaled to support both an aggressive carbon tax and a carbon subsidy, with the choice resting entirely on which defensible assumptions the analyst selects, the metric is measuring the assumptions chosen rather than any damage to the physical world.
The SCC’s lack of robustness is not a technical detail; robustness is the whole question. A number that can be tuned to justify almost any outcome cannot carry the regulatory weight the SCC now bears. Concretely, lawmakers should act on four fronts:
State officials have resisted these estimates before, and that experience is instructive. When the Biden administration reinstated the SCC in 2021, eleven states led by Missouri challenged Executive Order 13990 and the interim estimates in federal court, supported by an expert declaration from the author of this paper documenting how sensitive the underlying models are to their assumptions (Missouri v. Biden, 2021). The attorneys general of eighteen states, again led by Missouri, submitted that same declaration to the Interagency Working Group as an exhibit to their formal comment on the interim estimates, urging that the values be withdrawn (Attorneys General of 18 States, 2021). The courts ultimately dismissed the lawsuit on standing grounds rather than on the merits of that critique, so the substantive case against the SCC remains intact. States retain full authority over whether to import the metric into their own regulations, rate cases, and permitting, and this record gives them both the argument and the precedent to decline.
The social cost of carbon has the appearance of science; in practice, however, the metric behaves like a dial: turn the assumptions and the same model will report whatever the analyst needs, a catastrophic cost one day and a net benefit the next. A figure that malleable has no place in determining the price of American energy. Washington was right to set the SCC aside, and the states should not bring the metric back.
Attorneys General of 18 States. (2021, June 21). Comment on the technical support document: Social cost of carbon, methane, and nitrous oxide interim estimates under Executive Order 13990 [Comment letter, OMB Docket No. OMB-2021-0006]. https://www.regulations.gov/comment/OMB-2021-0006-0072
Challinor, A. J., Watson, J., Lobell, D. B., Howden, S. M., Smith, D. R., & Chhetri, N. (2014). A meta-analysis of crop yield under climate change and adaptation. Nature Climate Change, 4, 287–291. https://www.nature.com/articles/nclimate2153
Christy, J. R., & McNider, R. T. (2017). Satellite bulk tropospheric temperatures as a metric for climate sensitivity. Asia-Pacific Journal of Atmospheric Sciences, 53, 511–518. https://doi.org/10.1007/s13143-017-0070-z
Dayaratna, K. D. (2021). Declaration of Kevin D. Dayaratna [Expert declaration]. Missouri v. Biden, No. 4:21-cv-00287-AGF (E.D. Mo.).
Dayaratna, K. D., & Kreutzer, D. W. (2013). Loaded DICE: An EPA model not ready for the big game (Backgrounder No. 2860). The Heritage Foundation. https://www.heritage.org/environment/report/loaded-dice-epa-model-not-ready-the-big-game
Dayaratna, K. D., & Kreutzer, D. W. (2014). Unfounded FUND: Yet another EPA model not ready for the big game (Backgrounder No. 2897). The Heritage Foundation. https://www.heritage.org/environment/report/unfounded-fund-yet-another-epa-model-not-ready-the-big-game
Dayaratna, K. D., McKitrick, R., & Kreutzer, D. (2017). Empirically constrained climate sensitivity and the social cost of carbon. Climate Change Economics, 8(2), 1750006. https://doi.org/10.1142/S2010007817500063
Dayaratna, K. D., McKitrick, R., & Michaels, P. J. (2020). Climate sensitivity, agricultural productivity and the social cost of carbon in FUND. Environmental Economics and Policy Studies, 22, 433–448. https://doi.org/10.1007/s10018-020-00263-w
Frei, A., Dayaratna, K. D., & Gae, A. (2025). Calculating the “social cost of carbon” with the GIVE model: An EPA model not ready for prime time (Special Report No. 308). The Heritage Foundation. https://www.heritage.org/climate/report/calculating-the-social-cost-carbon-the-give-model-epa-model-not-ready-prime-time
Gae, A., & Dayaratna, K. D. (2025). Social cost of carbon: DSCIM’s unreliable foundations (Backgrounder No. 3908). The Heritage Foundation. https://www.heritage.org/energy/report/social-cost-carbon-dscims-unreliable-foundations
Kreutzer, D. (2024). Discounting climate costs (Issue Brief No. 4575). The Heritage Foundation. https://www.heritage.org/environment/report/discounting-climate-costs
Lewis, N. (2022). Objectively combining climate sensitivity evidence. Climate Dynamics, 60, 3139–3165. https://doi.org/10.1007/s00382-022-06468-x
Missouri v. Biden, No. 4:21-cv-00287-AGF (E.D. Mo. 2021), aff’d, No. 21-3013 (8th Cir. 2022), cert. denied (U.S. Oct. 10, 2023). https://www.supremecourt.gov/docket/docketfiles/html/public/22-1248.html
Office of Management and Budget. (2003). Circular A-4: Regulatory analysis. Executive Office of the President. https://obamawhitehouse.archives.gov/omb/circulars_a004_a-4/
H.R. 9970. Transparency and Honesty in Energy Regulations Act of 2024. 118th Congress. (2024)
Unleashing American Energy, Exec. Order No. 14154, 90 Fed. Reg. 8353 (Jan. 20, 2025).
U.S. Environmental Protection Agency. (2023). Report on the social cost of greenhouse gases: Estimates incorporating recent scientific advances. https://www.epa.gov/system/files/documents/2023-12/epa_scghg_2023_report_final.pdf
Zhu, Z., et al. (2016). Greening of the Earth and its drivers. Nature Climate Change, 6, 791–795. https://www.nature.com/articles/nclimate3004
Frei, A., Dayaratna, K. D., & Gae, A. (2025). Calculating the "social cost of carbon" with the GIVE model: An EPA model not ready for prime time (Special Report No. 308). The Heritage Foundation. https://www.heritage.org/climate/report/calculating-the-social-cost-carbon-the-give-model-epa-model-not-ready-prime-time
Gae, A., & Dayaratna, K. D. (2025). Social cost of carbon: DSCIM's unreliable foundations (Backgrounder No. 3908). The Heritage Foundation. https://www.heritage.org/energy/report/social-cost-carbon-dscims-unreliable-foundations
Gae, A., & Dayaratna, K. D. (2025). Social cost of carbon: DSCIM's unreliable foundations (Backgrounder No. 3908). The Heritage Foundation. https://www.heritage.org/energy/report/social-cost-carbon-dscims-unreliable-foundations
Dayaratna, K. D., McKitrick, R., & Kreutzer, D. (2017). Empirically constrained climate sensitivity and the social cost of carbon. Climate Change Economics, 8(2), 1750006. https://www.worldscientific.com/doi/abs/10.1142/S2010007817500063