
Policy Memo
Topline
The CBO has never released a comprehensive package of the methodology, code, and data behind its long-term model, which makes its projections hard to critique and the critiques that are made hard to judge.
Institute for Statistical Policy Analysis
Since its founding in 1974, the Congressional Budget Office (CBO) has become one of the most recognized sources for economic forecasting and policy analysis in the United States. There are few more widely cited projections of future economic growth or long-term fiscal health than those created by the organization. As evidenced by the organization’s substantial repository of models, the CBO has endeavored to do everything from measuring the demand for electric vehicles to predicting the balance of the Social Security trust fund decades in the future (Congressional Budget Office, n.d.).
Given the esteem in which it is held and the consequent potential for its analyses to substantially influence policy discussions, the CBO has received criticism from entities across the political spectrum over the years. A number of these criticisms have focused on the assumptions underpinning the models the organization has developed (Leeper, 2024; Paul, 2022; Penner, 2016), including those of the Congressional Budget Office Long-Term (CBOLT) model. CBOLT serves as the basis for much of the CBO’s long-term budget projections, which are held in high regard as evidence of where federal fiscal currents are likely to head, not only in the next few years, but in the next few decades as well. The model itself consists of four components: a demographic model, a microsimulation model to project year-to-year demographic and economic changes, a long-term budget model, and a policy-growth model (Barello & Pineles-Mark, 2018, p. 1).
To build out projections within each of these requisite components, the CBO draws on data from a number of sources, including the Census Bureau and the Social Security Administration (Barello & Pineles-Mark, 2018, p. 2). However, many of the inputs into the model are actually CBO projections themselves (Barello & Pineles-Mark, 2018, p. 2). This includes long-term economic projections of measures like inflation and unemployment. And while these and other components of the model are made public by the CBO, other details, including the actual formulas that dictate the dynamics of the model, the underlying code that allows the model to function, and much of the underlying data are not available to the public.
This lack of transparency makes it difficult to judge the soundness and validity of CBOLT or accurately assess critiques of its projections. Consider that assumption-based critiques of CBOLT, as well as other CBO models, tend to follow one of two paths: (1) focusing on the justifications for assumptions made within the model and (2) focusing on the layering of said assumptions. However, as is the case with CBOLT, if the underlying methodology, data, and code used to run the model are not publicly available, such critiques become difficult to make or assess. The CBO does in fact publish the code to 31 of its models online (Congressional Budget Office, n.d.). However, CBOLT is not among these.
What is more, there are times when new legislation necessitates the creation of a new model or the use of ad hoc modeling methods to project the effects of said legislation. One problem with this is that if the underlying methodology, code, and data sources are not made readily available to the public in a timely manner, it becomes virtually impossible to effectively critique such projections before major legislation is passed. An example of this would be the modeling efforts that took place during the congressional debate over passage of the Affordable Care Act (ACA). While the CBO did release a background paper for a health insurance simulation model in 2007 (Congressional Budget Office [CBO], 2007), it is not clear that any ACA-specific changes were made or that documentation for such an alternative model was ever made public during the course of debate over the ACA’s passage.
Cases like this illustrate the importance of understanding and scrutinizing the reasons why the transparency of certain CBO models, such as CBOLT, is lacking. A question about how legal restrictions in particular limit such transparency was raised by various Representatives in follow-up questions to a November 18, 2025 hearing of the House Committee on the Budget that featured CBO Director Phillip Swagel, with the CBO responding as follows:
CBO looks to further improve transparency, but in some instances, legal restrictions affect the agency’s ability to make models available. Making some models publicly available would allow users to take projections that CBO has already published and reverse-engineer the values of inputs to those models. Because those models’ input data are legally restricted and cannot be disclosed, the models cannot be disclosed. Restricted data are confidential, proprietary, or otherwise sensitive data that are safeguarded under strict federal standards. For example, CBO must adhere to federal statutes that bar the disclosure of federal tax information and to federal privacy laws that protect individually identifiable data, which are often required in CBO’s analyses. (Congressional Budget Office, 2026, p. 9)
While limiting public access to CBOLT code and data may be required, it also makes it more difficult for the public to assess the validity of such models. Thus, in assessing the ability of CBO to accurately project economic and fiscal conditions into the distant future, we are left only with a few snapshots of a larger design, a design that itself has the ability to influence major policy debates. In an attempt to get around this, and to emphasize the point of how stacking assumptions can increase the potential for greater error downstream, this paper offers a case study of the inputs that would have formed the basis of CBOLT’s 2016 projections.
When a new policy is proposed at the federal level, the CBO is often tasked with attempting to measure its long-term economic and fiscal implications. Relevant data is compiled. The data is fed into a model designed to project the effects of said policy on issues from the solvency of the Social Security trust fund to job openings in the coming years. Results are generated and published. Then, the controversy begins. Critics on the left or the right (sometimes both, depending on the issue) criticize the results and argue that they are invalid. While the reasons for this vary, critiques of such modeling tend to primarily focus on the assumptions underlying the model in question. This is the first type of criticism, in which the assumption itself is questioned.
Consider a tax cut on labor income. If the projected growth effects of said cut are particularly strong, critics on the left might argue that the model’s assumption of how savings and, ultimately, business investment respond to lower taxes on labor income is overstated. If the projected growth effects of said cut are particularly weak, critics on the right might argue the opposite. Thus, it is fair to expect that controversy will eventually arise when the creators of one model settle on a given parameter to bake in as an assumption to the model. Some modelers might acknowledge this by adjusting the parameter in question, such as the responsiveness of savings and investment to labor income taxation, and running multiple simulations that keep everything else constant. Others might make the parameter endogenous and allow it to vary based on changes in the input data or the nature of the results. Regardless, controversy will always arise with respect to the assumptions underlying the model.
The second path of criticism also focuses on assumptions, but rather than placing attention on the justifications underlying the assumptions themselves, it instead focuses that attention on the effects of layering the assumptions in question on top of one another. Again, take the same example of a tax cut on labor income. Beyond criticisms of the assumptions baked into the model in question, critics might also focus on the ways in which uncertainty and the potential for error are potentially compounded when assumptions are stacked on top of one another. In the example, one such assumption is the one already mentioned: the response of savings and investment to taxes on labor income. However, another assumption within the model in question might be the response of workers to lower taxes on labor income. If the elasticity is high, meaning that a tax cut will lead to far more labor hours being supplied, that might engender negative reactions from critics on the left, while an assumption of relatively low elasticity might engender the same reaction from critics on the right. Regardless of what final parameters are chosen, two controversial assumptions have now been made. To whatever extent there is uncertainty or outright error in the parameters chosen, the potential for both to be compounded can increase by the simple fact that they have both been baked into the model in question.
Criticisms of CBO modeling have followed both the paths described: criticisms of the assumptions baked into their various models and criticisms of the fact that their models layer assumptions upon assumptions, thus increasing the potential for uncertainty and error. However, criticisms of the latter vintage have perhaps been somewhat rarer. A reason for this could be that it is somewhat easy to find one very specific assumption on which a given CBO model rests and begin attacking the justifications for that assumption on the basis that such justifications do not track with empirical evidence. However, the interplay between the various assumptions and parameters within these models requires a deeper understanding not only of what all of these assumptions and parameters are, but of how they build on, contribute to, and generally relate to one another. This requires a much deeper knowledge of the methodologies of these models and a willingness to commit the time necessary to understanding these inner workings. For a person on either the left or the right seeking the easiest way to criticize the results of a given model, that can seem like a costlier mode of critique than simply picking one or two assumptions he or she sees as an easy target. Why spend more time trying to dissect the complex interplay of various assumptions within a model rather than focusing my attack on one or two that may be relatively simple to criticize?
To illustrate how the second path of criticism, the layering of assumptions, can actually impact long-term projections downstream, the current paper focuses on projections made by the CBO for their January 2016 long-term projections in The Budget and Economic Outlook: 2016 to 2026 (Congressional Budget Office, 2016). Given the fact that the CBO utilizes a 10-year time horizon for these projections, assessing the accuracy of the 2016 projections exactly one decade later makes sense. To take inflation as an example (Figure 1), the CBO forecasted in 2016 that annual inflation would average 2.3% per year between 2016 and 2025. Inflation between 2016 and 2025 was actually 3.1%. That said, the period in question does include the COVID-19 pandemic and the federal response to it. As we know, the massive infusion of money into the economy by the federal government during lockdowns caused prices to spike at rates not seen since the 1980s. However, even if we exclude the years of and immediately following the federal response to the pandemic (2020-2022), inflation over the period was still 2.8%.
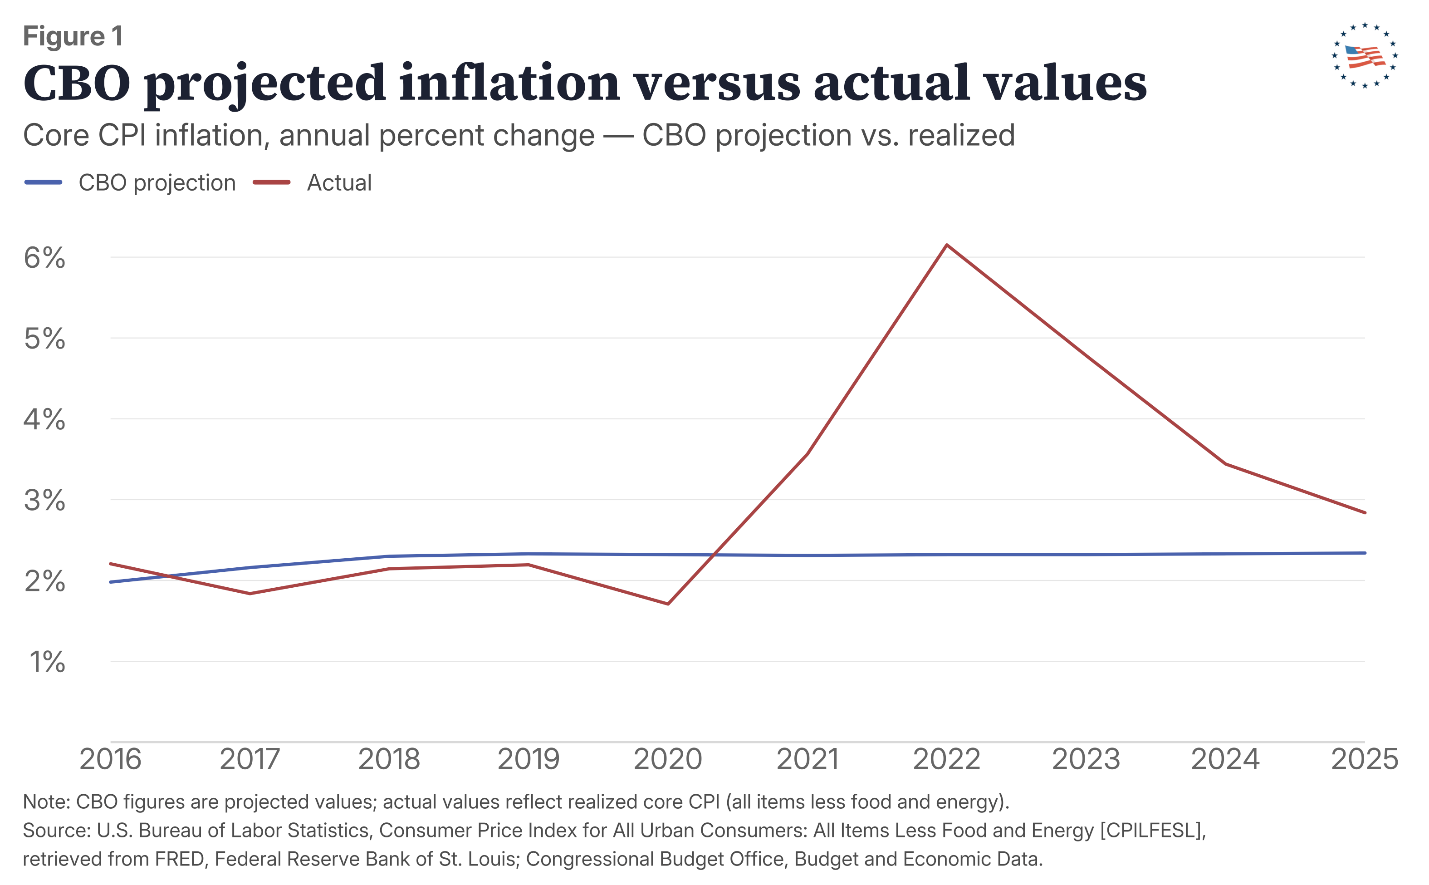
Now, a difference between 2.3% and the lower-end estimation of 2.8% might not seem like a lot, but in a macroeconomic sense, that is not insignificant. Consider that the Social Security Trust Fund is currently valued around $2.56 trillion in assets (Social Security Administration [SSA], 2026). Over a 75-year time horizon, which is the period of time which the CBO uses for its projections for the long-term health of Social Security, the difference between $2.56 trillion growing at a hypothetical 2.3% annual rate versus a hypothetical 2.8% annual rate is the difference between $14.09 trillion and $20.31 trillion at the end of those 75 years, respectively. What is more, our purpose herein is not to focus on differences of this sort on one margin or another, but rather to expound upon how these differences can build on one another and ultimately compound the potential for error in both long-term economic and long-term fiscal projections.
In illustrating this second path of criticism, how the layering of assumptions can actually impact long-term projections, this case study examines a hypothetical application of the CBO’s Long-Term Actuarial model (LTAM). The roots of this model extend back to efforts in the late 1990s and early 2000s to measure the long-term stability of Social Security (O’Harra et al., 2004, p. 3). During that time, there was a burgeoning concern that the Social Security trust fund would become insolvent in the coming decades, particularly as Baby Boomers began to retire. At the time, the Social Security Administration (SSA) provided actuarial assessments of the fund’s long-term stability on an annual basis (Meyerson et al., 2001, p. 2). However, LTAM was developed by the CBO as a means of going beyond expected effects to offer a more global, stochastic-based assessment of how policy choices might affect the system’s long-term health (Meyerson et al., 2001, p. 2). It is unclear if LTAM was a precursor to CBOLT, but the background contained in Meyerson et al. (2001) makes it appear as though there are similarities. However, regardless of that fact, the point here is not to establish the lineage of CBOLT, but rather to demonstrate how the CBO’s stacking of assumptions can increase the potential for error in long-term projections. What should be obvious from both CBO’s description of the interplay and their own mapping in Figure 2 is that their projections are often predicated on a complicated, interwoven network of assumptions and projections that influence, and are themselves influenced by, other assumptions and projections. When one higher-order input, such as inflation, is off, even by a small amount, the effects of that have the potential to compound as we move downstream, thus increasing the potential for error. This is not to say that the compounding of such errors will definitively make for greater error downstream. It is possible that errors could end up cancelling each other out. For example, if an inflation forecast was too high, but so too was the nominal GDP projection, then the real GDP projection might end up roughly tracking with what actually happened. What is true is that the potential for greater error can increase with each layer of assumptions baked into the model in question.
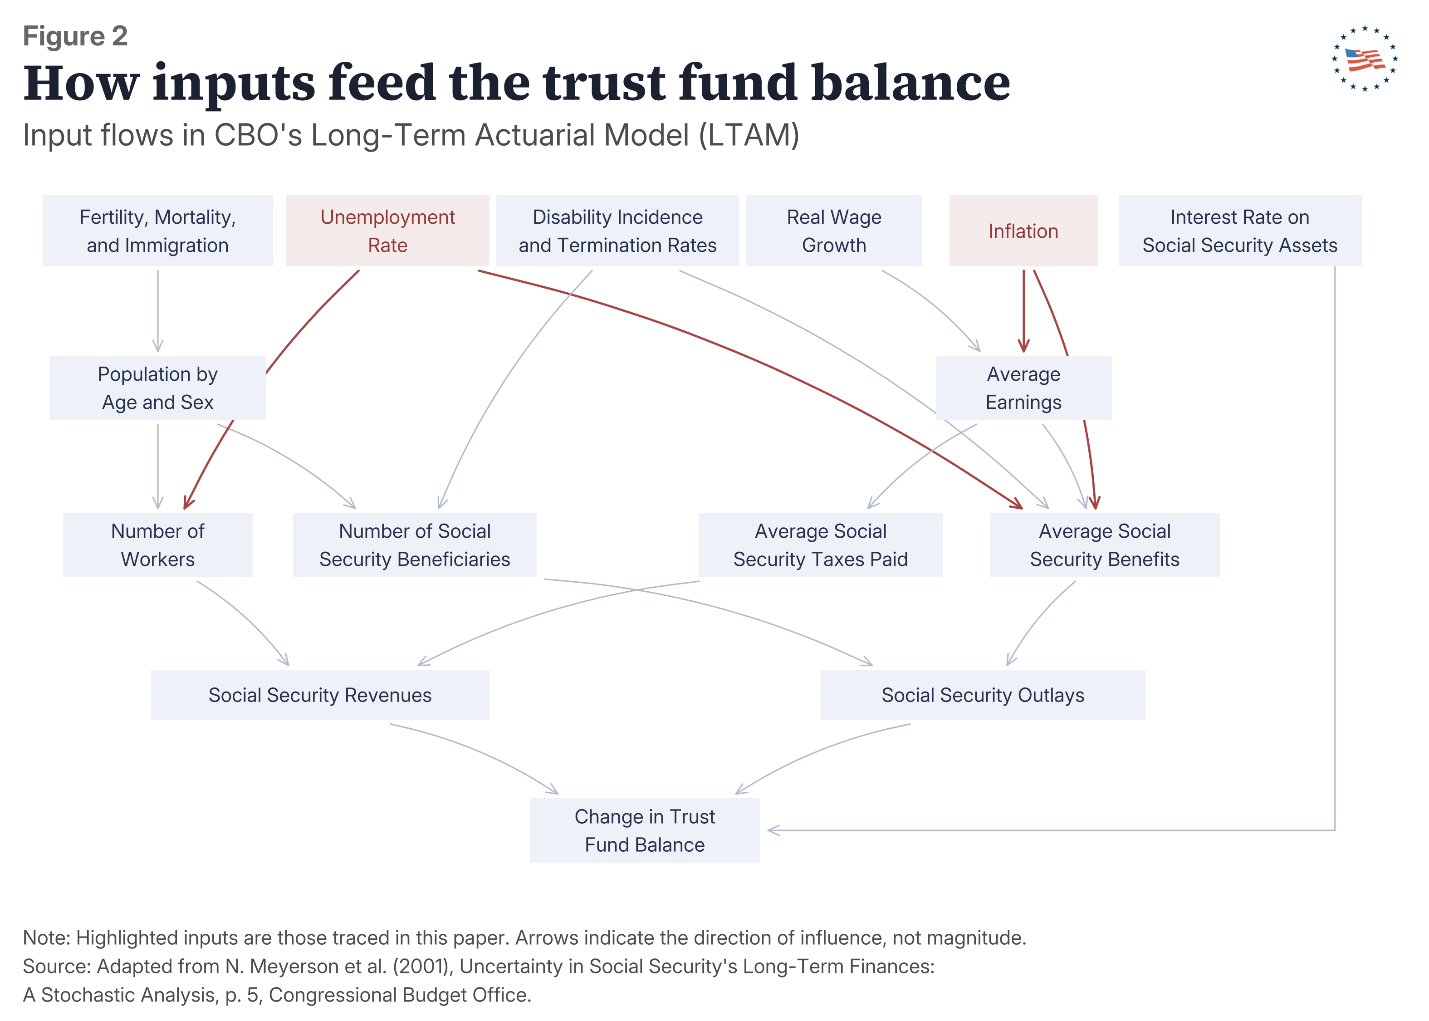
To continue with our assessment of layering assumptions, let us consider the unemployment rate (Figure 3) in addition to the inflation rate. The CBO projected that the average annual unemployment rate would be 4.9% from 2016 through 2025. The actual average over that period of time was 4.6%. However, if we exclude just 2020, that figure drops down to 4.2%, and if we exclude the same years (2020-2022) that we excluded as an illustrative example with inflation, it drops to 4.1%. The difference between 4.9% and the higher-end figure of 4.6% is 0.3%, which again might not seem like a large difference, but is indeed important in a macroeconomic sense. However, as previously stated, the point here is not to focus on the differences in projections versus what actually happened, but rather to trace the downstream effects of those differences. As you can see in Figure 2, both inflation and the unemployment rate feed into multiple other parameters contained within the model. In our example, inflation over the period from 2016 to 2025 was higher than anticipated. Given that Social Security makes cost of living adjustments, this means that expenditures for the program could have increased more than initially expected over the period in question, if the CBO had hypothetically utilized a framework similar to the one used in the LTAM report for its 2016 numbers. With regards to projections about the unemployment rate over the same period of time, a lower-than-expected unemployment rate means that there are likely more individuals contributing to the Social Security trust fund via their payroll taxes than projections would have initially expected, meaning that revenues over that same period of time are likely higher as well.
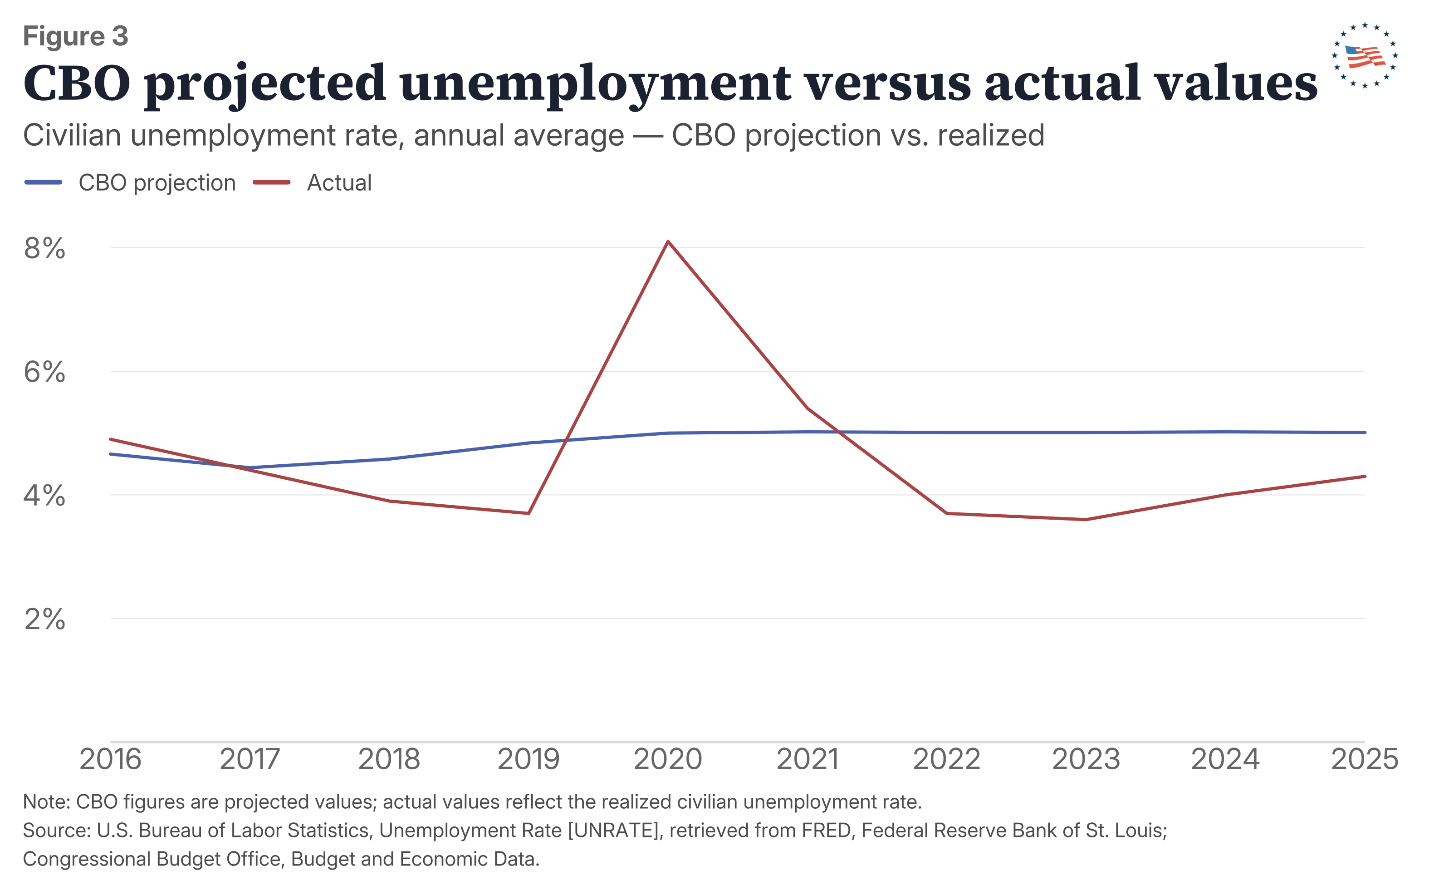
As you can see, this is an excellent example of a case where two projections, though off by a bit, could end up cancelling each other out: higher-than-expected inflation increases expenditures, while lower-than-expected unemployment increases revenues. Therefore, people judging the analytical validity of the projections in question might simply look at the results and say, well done, CBO. However, this is problematic because, even if the results of the projections end up mirroring reality rather closely, the reason for this is not because the projections were individually correct, but because the compounding of these projections made it so that the errors cancelled each other out. But what if the opposite had been the case? What if instead of lower-than-expected unemployment, the unemployment rate over the period in question had actually been higher? In that case, fewer individuals would have been contributing to the Social Security trust fund via payroll taxes, meaning that revenues would have been lower than expected. If that were the case, and if the inflation reality played out exactly the same way as it did, then higher expenditures would have accompanied those lower revenues. In that case, it is likely that, all else equal, the Social Security trust fund would have been significantly more depleted than expected.
What is more, these are not the only two effects that would have to be considered in projections utilizing a model of this sort. Consider Figure 2 again. The unemployment rate is not just utilized to indirectly calculate Social Security revenues. It is also used to calculate Social Security benefits, as periods of unemployment contribute to the overall calculation of benefits upon retirement: generally speaking, the longer the periods of unemployment, the lower a person’s lifetime earnings and the lower his or her calculated benefits will be upon retirement. Therefore, in the period in question, even if the effect of lower-than-expected unemployment on the revenue side and higher-than-expected inflation on the expenditures side cancelled each other out, the effect of lower-than-expected unemployment leading to higher average benefits would mean that the Social Security trust fund would likely still be worse off today than a model of this sort might have predicted in 2016, all else equal. Without greater transparency about the methodology and code behind CBOLT, we are left only to speculate about the magnitude of such effects and whether or not they would actually cancel each other within the complex ecosystem of a model like CBOLT. Without greater transparency concerning the underlying structure of the modern version of CBOLT, as well as the data sources used to make these calculations, we cannot accurately assess the validity of the assumptions being made, which in turn prevents us from being able to make deeper assessments about the underlying uncertainty and potential for compounded downstream error in CBOLT projections.
Without greater transparency into the underlying methodology, code, and data used to construct CBOLT and run projections, the public is left to try to piece together the greater design from other sources. The CBO has published certain methodological overviews of CBOLT (Barello & Pineles-Mark, 2018), but without more detailed information and access to underlying data, it is difficult for even the most seasoned modelers to try to replicate the results of the CBO’s projections of future economic and fiscal conditions. Given this, the CBO, as part of its renewed commitment to increasing transparency, should focus on building out a more comprehensive replication set for each of its periodic CBOLT projections. The CBO already releases some of these data sources and references them in its periodic projections. However, (1) a comprehensive methodology, (2) the code necessary to run the model, and (3) other sources of data necessary to run the model are not publicly available.
In reference to the point about data, if the concern is that such code will allow the reverse engineering of data containing personally identifiable information (PII) and ultimately result in privacy issues, the CBO could randomize the data and create public-use microdata that shields PII, like the Internal Revenue Service (IRS) does with tax data. Additionally, if certain data is already being withheld on the basis that it could result in breaches of privacy, then why is withholding code necessary at all? Is withholding the data that could potentially result in privacy concerns not enough to allay said concerns? It remains unclear why releasing a full methodology and set of code, but not the sensitive sources of data, would not simply allow other modelers to at least replicate some portion of the projections themselves. Finally, where there is potentially sensitive information involved, it may be time for the CBO to begin a reassessment of whether or not information that is being withheld does indeed constitute sensitive information. In cases where such a reassessment deems the release of certain information to potentially be in breach of privacy laws, the CBO might benefit from explicitly stating (1) to which sources of data such concerns apply and (2) the relevant laws and restrictions that prohibit them from publishing said data. This would allow the public in general to consider whether or not such restrictions are necessary and, if they feel they are not, (1) advocate for measured adjustments to current law to increase data access or (2) advocate for total repeal to achieve the same result. The CBO does excellent work coalescing proprietary data from a number of sources to which the general public does not have access and that makes for richer projections than other sources of data might allow. However, without a more open discussion about current transparency issues, it is hard to debate openly the efficacy of current privacy practices.
The perils of modeling long-term economic and fiscal conditions are evident to anyone who has ever engaged in the practice. Structural forms must be carefully considered and vetted and assumptions must be carefully thought through and weighed in relation to other assumptions. When complex models are created, they essentially become ecosystems unto themselves, paradigms in which small changes in one parameter or another can have profound, system-wide impacts. CBOLT is one such example. It serves as the basis for much of the long-term fiscal forecasting made by the CBO. Despite this, there is not a great deal of information about how the model is actually structured and the data sources used to run it. The CBO has indeed published information about some of the data sources utilized and certain assumptions made within the model, but it has not published a comprehensive methodology, the underlying code, and many of the data sources used to make the model run. Thus, critiquing the potential for uncertainty and error in CBOLT is somewhat difficult to do. In an attempt to get around this problem, the current paper has developed a case study of the CBO’s 2016 economic projections and framed it within a hypothetical assessment of how such economic projections would have affected Social Security projections under a framework similar to LTAM, an actuarial model that may or may not be a precursor to part of the current version of CBOLT. In doing so, the current case study has assessed some of the potential perils of assumptions made within these projections, but more importantly, it has sought to draw attention to the potential for increased uncertainty and compounded error when such assumptions are stacked on one another. Such a case study can be useful, but a fuller, direct assessment of CBOLT would be even more useful. This is why the CBO is urged to consider the recommendations made in this paper, recommendations that would make the CBO’s modeling process more open and transparent to the public, which in turn would allow for a more robust public debate about its processes.
Barello, S., & Pineles-Mark, C. (2018). An overview of CBOLT: The Congressional Budget Office long-term model. Congressional Budget Office. https://www.cbo.gov/system/files/115th-congress-2017-2018/reports/53667-cbolt.pdf
Congressional Budget Office. (n.d.). Advanced models and details. https://www.cbo.gov/models/details
Congressional Budget Office. (2007, October 31). CBO’s health insurance simulation model: A technical description. https://www.cbo.gov/publication/19224
Congressional Budget Office. (2016, January). The budget and economic outlook: 2016 to 2026. https://www.cbo.gov/sites/default/files/114th-congress-2015-2016/reports/51129-2016outlookonecol-2.pdf
Congressional Budget Office. (2026, January 30). Answers to questions for the record following a hearing on oversight of the Congressional Budget Office. House Committee on the Budget, 119th Congress. (answers to questions in follow-up to testimony of Director Phillip Swagel). https://www.cbo.gov/system/files/2026-01/62023-QFRs.pdf
Internal Revenue Service. (2026, May 22). SOI Tax Stats - Individual public-use microdata files. https://www.irs.gov/statistics/soi-tax-stats-individual-public-use-microdata-files
Leeper, E. (2024, February 2). Improving CBO projections [Testimony]. Mercatus Center. https://www.mercatus.org/research/federal-testimonies/improving-cbo-projections
Meyerson, N., Sabelhaus, J., Simpson, M., & Smith, J. (2001). Uncertainty in Social Security’s long-term finances: a stochastic analysis. Congressional Budget Office. https://wayback.archive-it.org/6820/20210214042824/https://www.cbo.gov/sites/default/files/107th-congress-2001-2002/reports/socsecuncertainty.pdf
O’Harra, J., Sabelhaus, J., & Simpson, M. (2004). Overview of the Congressional Budget Office Long-Term (CBOLT) Policy Simulation Model. Congressional Budget Office. https://www.cbo.gov/sites/default/files/108th-congress-2003-2004/workingpaper/2004-01_0.pdf
Paul, M. (2022, March 8). Congress looks to the CBO for economic expertise: is that a mistake? (with Mark Paul) [Interview]. PitchforkEconomics.com. https://pitchforkeconomics.com/episode/congress-looks-to-the-cbo-for-economic-expertise-is-that-a-mistake-with-mark-paul/
Penner, R. (2016, November 30). The reliability of long-term budget projections. Urban Institute. https://www.urban.org/research/publication/reliability-long-term-budget-projections
Social Security Administration. (2026, June 9). Social Security Board of Trustees: Projection for combined trust funds remains consistent with prior year [Press release]. https://www.ssa.gov/news/en/press/releases/2026-06-09.html
U.S. Bureau of Labor Statistics. (2026). Consumer Price Index for All Urban Consumers: All items less food and energy in U.S. city average [CPILFESL] [Data set]. Federal Reserve Bank of St. Louis. https://fred.stlouisfed.org/series/CPILFESL
U.S. Bureau of Labor Statistics. (2026). Unemployment rate [UNRATE] [Data set]. Federal Reserve Bank of St. Louis. https://fred.stlouisfed.org/series/UNRATE