Institute for Statistical Policy Analysis · Plymouth Institute for Free Enterprise
Topline
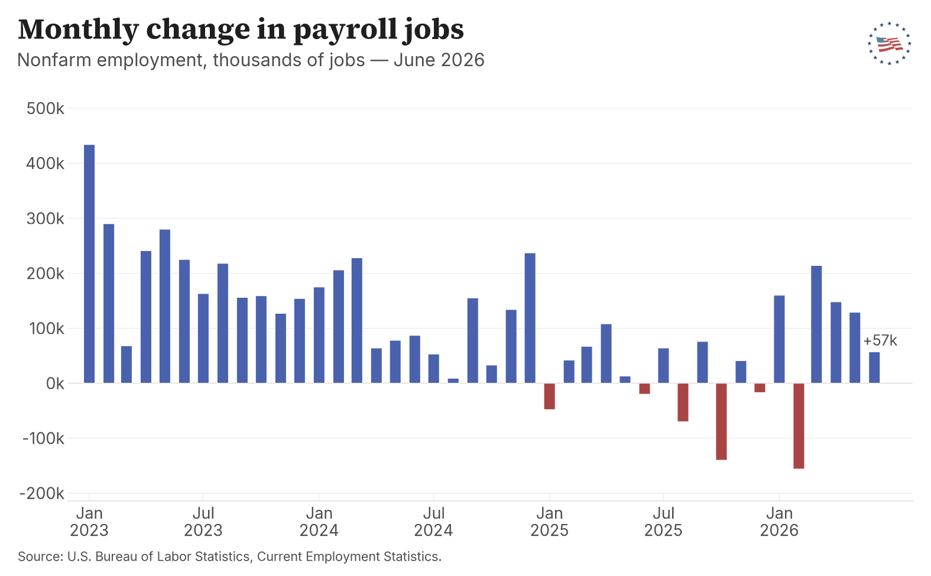
June payroll employment increased by 57,000 jobs, while the unemployment rate edged down to 4.2 percent, from 4.3 percent in May.
Background
The Bureau of Labor Statistics (BLS) reported the 4th consecutive month of positive job growth, with an estimated gain of 57,000 jobs in June.
April and May job gains were revised downward by a combined -74,000, largely offsetting May’s +93,000 upward revisions to the two prior months.
Total average job gains of 137,000 per month over the last four months are in sharp contrast to an average monthly loss of –5,000 jobs during the 10 months the Liberation Day tariffs were in effect.
However, job growth still lags below the pre-COVID average of 195,000 jobs added per month.2
Figure 1
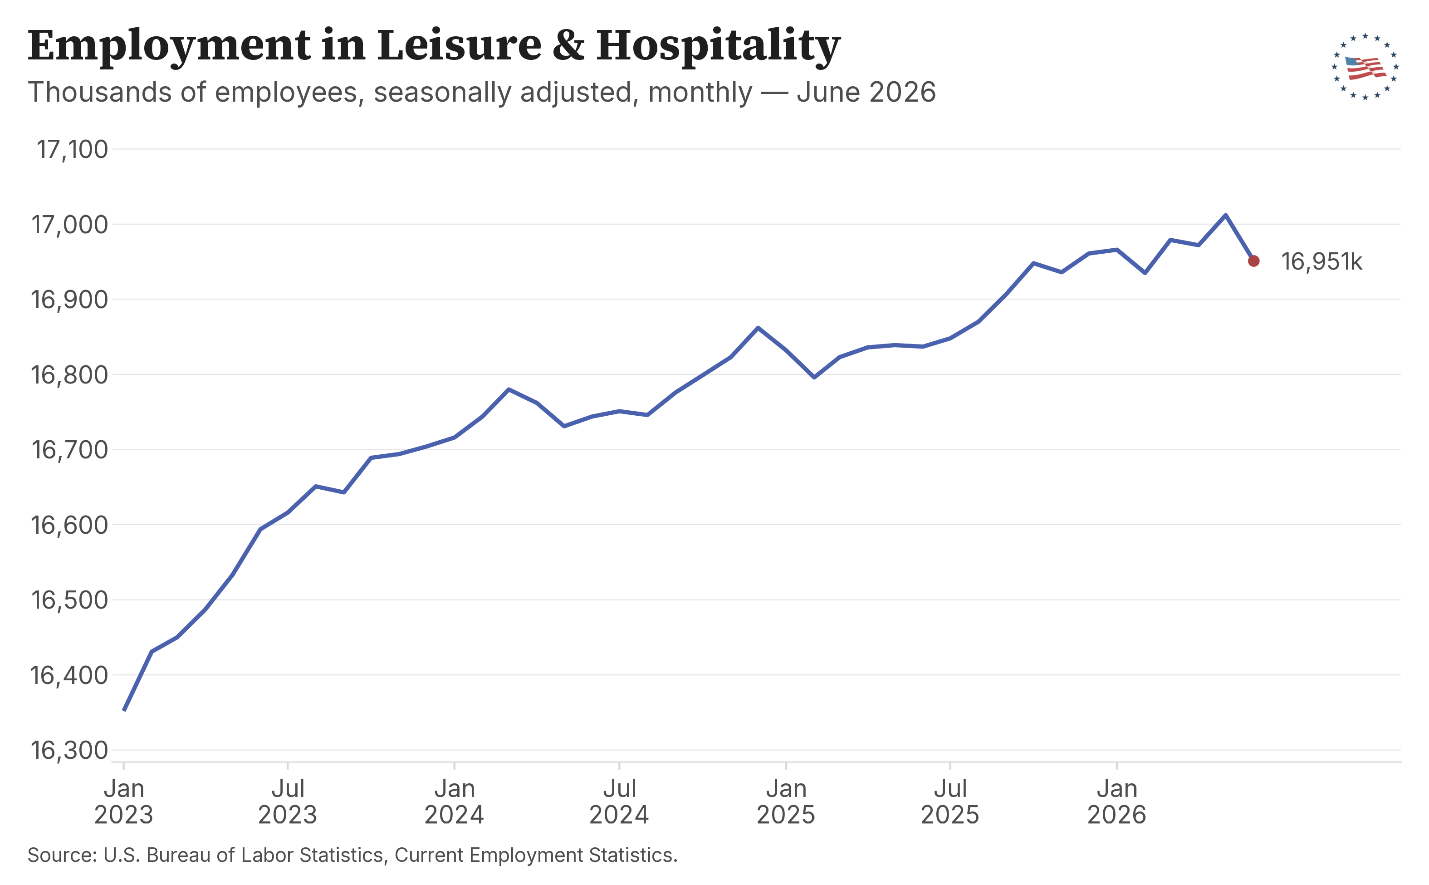
The leisure and hospitality sectors saw a statistically significant loss of 61,000 jobs in June, which follows a revised 40,000 increase in May.
These significant swings could be the result of how the BLS’ seasonal adjustments interacted with the one-time tourism impacts of the FIFA World Cup in the U.S.
While seasonally adjusted figures are typically what matter, it’s worth noting that on a seasonally unadjusted basis, employment in the leisure and hospitality sector in June was at its highest level since measurement began.
Figure 2
The highly subsidized healthcare and social assistance sectors continued to dominate job growth in June with respective gains of 22,000 and 25,000.
The remaining sectors in the private economy (such as construction, manufacturing, retail trade, information, etc.) did not experience statistically significant employment gains or losses.3
Excluding healthcare and social assistance, the private sector gained just 2,000 jobs in June.
Positive Reduced Tariff Trends Continue
While job growth was not as strong in June as in the prior three months, job gains have continued to trend upward since restrictions on the Trump Administration’s tariffs began in February 2026.
Between Liberation Day in April 2025 and the Supreme Court’s ruling against the Administration’s International Emergency Economic Powers Act (IEEPA) tariffs in February 2026, private sector job growth averaged just 20,000 per month.
In the four months since, private sector job growth has averaged 125,000. Excluding the highly subsidized healthcare and social assistance sectors, private jobs declined by an average of -31,000 per month during the 10 IEPPA tariff months and have averaged a gain of 64,000 in the four months since.
Hourly Earnings Climb Back Up
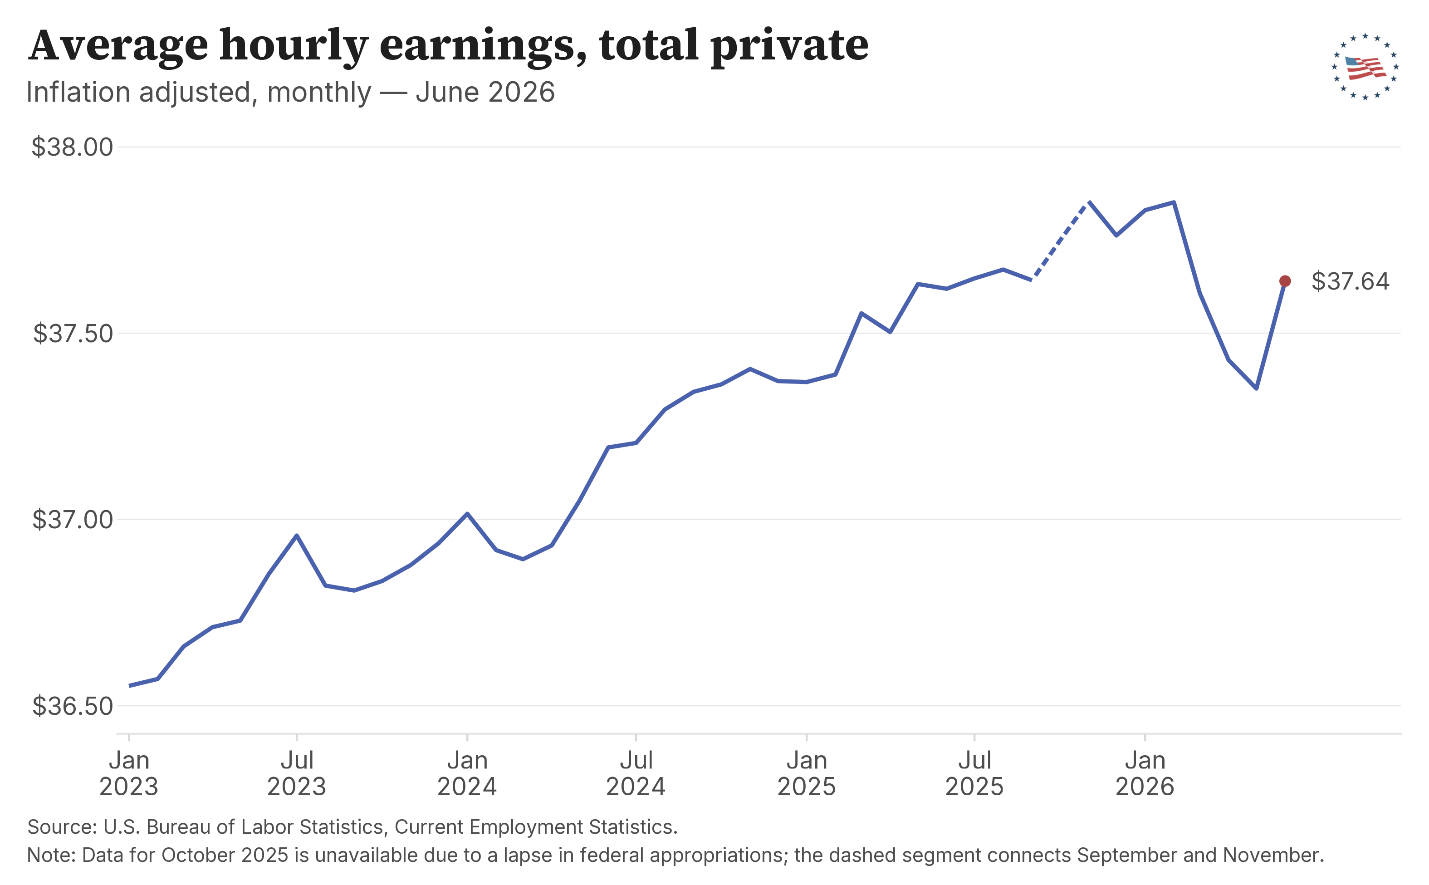
Average hourly earnings for private sector workers increased by $0.13, to $37.64.4
Combined with a -0.4% drop in the CPI-U inflation measure, the average worker’s real, inflation-adjusted wage was up by 0.8%, or $0.30 per hour in June.
June’s real wage gains follow a steep 1.3% decline in real average hourly pay between February and May as Iran’s closure of the Strait of Hormuz caused energy prices to surge.
The recent spike in inflation caused real wages to fall off from an otherwise upward trend, which peaked at the equivalent of $37.84 in February 2026.
Figure 3
Unemployment Rates and Employment-to-Population
The unemployment rate dropped to 4.2 percent in June.
However, this was due to more individuals dropping out of the labor force—those neither working nor actively seeking employment.
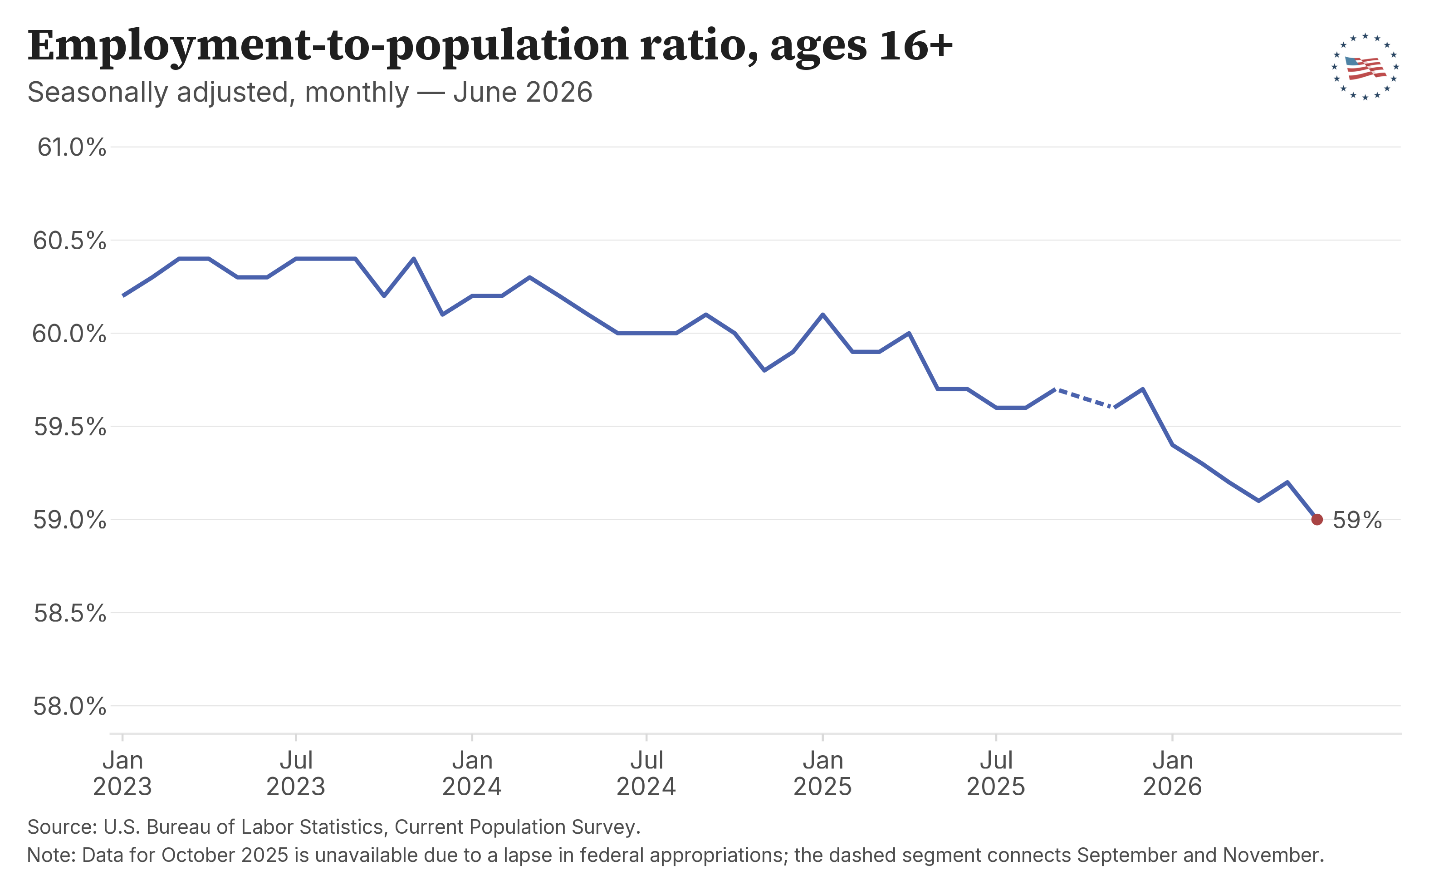
The employment-to-population ratio—or employment rate—which captures both labor force participation and unemployment declined by 0.2 percentage points to 59.0 percent. This is a new post-COVID low.
The decline in the employment-to-population ratio was almost entirely due to a sudden and highly unusual 1.5 percentage point drop in employment among workers ages 25-34.
The household survey that produces these figures is based on a relatively small sample of 60,000 households, so it is too soon to draw any conclusions from this significant one-month decline that could be a statistical anomaly.
The long-term downward trend in the overall employment-to-population ratio, however, is quite consistent and paints a worrying picture for the long-term health of the economy.
A large part of the long-term decline in employment is due to the large baby boomer population retiring from the workforce.
However, younger Americans ages 16 to 24 have also experienced significant employment declines over the past quarter-century, from almost 60% being employed in January 2000 to just 50% in June 2026.
Figure 4
Bottomline
The June job report was less positive than the previous three months. However, June’s report is an improvement compared to job reports during the 10-months of Liberation Day tariffs. Continued downward trends in the labor force participation rate and employment-to-population ratio remain concerning because strong economic growth requires high employment.
Notes
The Liberation Day tariffs period includes April 2025 through February 2026 while the pre-COVID average refers to the period between January 2011 and February 2020 (post-Great Recession recovery and pre-COVID-19 pandemic).
Based on the BLS’ reported 90% confidence intervals for each sector.
Wage data for government workers is not available; the BLS reports wages for private sector workers only.