📄 Download the full report (PDF)
Kevin Dayaratna, Vice President
Kat Miller, Policy Analyst
May 28, 2026
EXECUTIVE SUMMARY:
ABSTRACT
Behind nearly every major gain in modern living standards is a common factor: expanded access to energy. Over the past century, large increases in energy use have coincided with substantial gains in income, productivity, health, and living standards. While energy and economic output have become less tightly linked in some advanced economies—a phenomenon often described as "decoupling"—this reflects improvements in efficiency and structural shifts toward less energy-intensive sectors, rather than a diminished role for energy itself. Drawing on long-run historical trends and cross-country comparisons, this paper shows that higher levels of energy consumption are consistently associated with higher per capita income, greater labor productivity, increased agricultural output, and improved public health outcomes, including longer life expectancy and lower child mortality. These relationships hold across countries at every stage of development. The relationship between energy use and prosperity is best understood as one of simultaneity: energy access supports production and incomes, while rising incomes in turn finance further energy use. No country has achieved high incomes, long life expectancy, or low child mortality without substantial energy consumption. As a result, policies that expand energy availability, improve reliability, and support a diverse portfolio are critical to sustaining economic growth and living standards worldwide.
Introduction
Over the past century, large increases in energy use have coincided with substantial gains in income, productivity, health, and living standards. Access to affordable and reliable energy—often taken for granted in advanced economies—has been central to these improvements, powering everyday technologies such as computers, cell phones, and household appliances. This relationship is not incidental: energy enables production, supports technological adoption, and allows households and firms to operate more efficiently across nearly every sector of the economy (Smil, 2017).
Evidence from both long-run historical trends and cross-country comparisons points to a consistent pattern. As energy consumption rises, so do key indicators of economic performance—such as income and productivity—and broader measures of living standards, including life expectancy and child mortality among others. These relationships appear across countries at different stages of development and across multiple dimensions of human welfare.
The relationship between energy consumption and economic prosperity is best understood as one of simultaneity rather than simple one-way causation. Energy access enables production and raises incomes; rising incomes in turn finance further energy infrastructure and support more energy-intensive consumption. The two variables co-evolve in a mutually reinforcing process, which helps explain both why their correlation is so consistent across countries and over time, and why decades of econometric work have struggled to identify a clean unidirectional causal relationship (Kraft & Kraft, 1978; Ozturk, 2010). While energy in and of itself does not determine outcomes, it is a necessary prerequisite for creating and sustaining modern levels of income, health, and productivity.
This pattern is consistent with the developed and developing decoupling results presented later in this paper, and it carries an important policy implication: restricting energy access risks not merely forgoing a marginal input but disrupting the self-reinforcing dynamic through which countries raise living standards. Building on prior research on the relationship between energy use and human well-being, including the authors’ earlier work, this paper incorporates more recent data and expands the analysis across a broader set of outcomes.[1]
The sections that follow examine this relationship across several dimensions. They begin with the diffusion of energy-enabled technologies and their role in transforming daily life, then turn to economic outcomes, focusing on income and labor productivity, and next consider agriculture, where energy supports significant gains in crop yields and food production. Finally, it examines public health outcomes, including life expectancy, child mortality, and broader measures of environmental health. Across each of these domains, a consistent pattern emerges: greater access to affordable and reliable energy is closely associated with improved living standards.
How Energy-Enabled Technologies Transform Daily Life
Figure 1 displays various household technologies and their use among U.S. households over time.
Figure 1
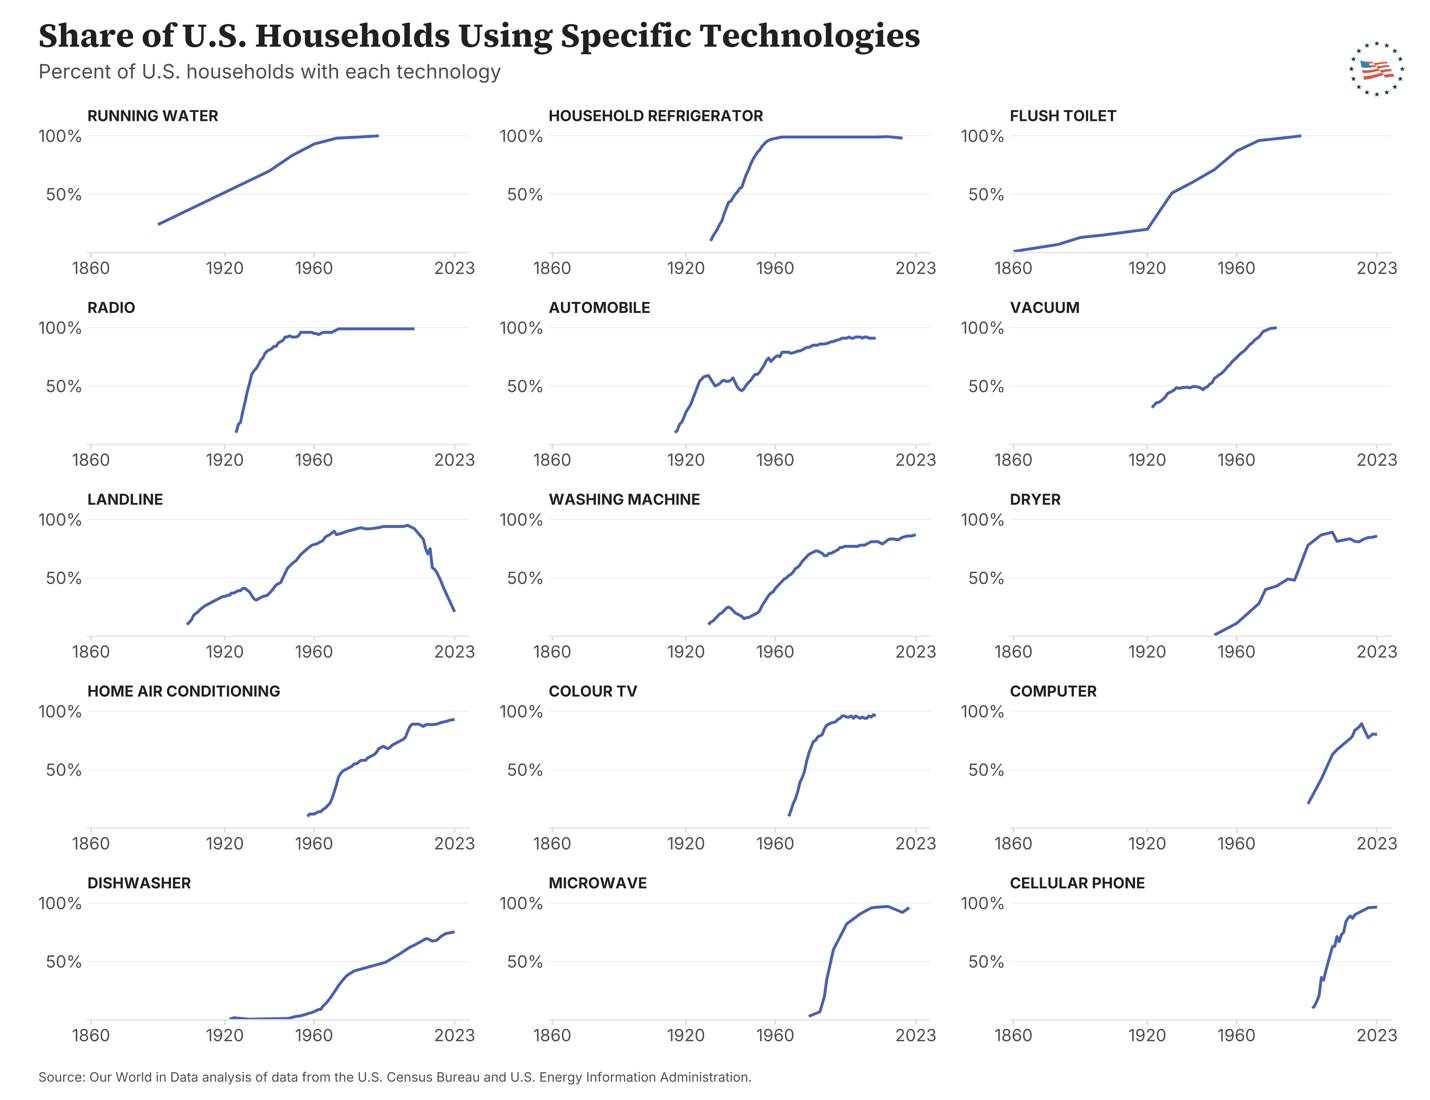
The pattern is consistent across generations of innovation: once technologies become affordable and scalable, adoption accelerates rapidly and eventually reaches near-universal levels. Technologies such as radios, cars, and washing machines were quickly adopted during the 1920s and post–World War II eras. Radios in particular were adopted rapidly during this earlier period, reaching mainstream use in about 25 years. In 1931, roughly 52 percent of households were using this technology, and by the late 1940s, adoption exceeded 90 percent of households.
Many other technologies besides radios, including cars and washing machines, follow an S-shaped curve, where adoption begins slowly but then accelerates as its use becomes mainstream, only slowing once it approaches nearly full saturation, typically at least 90 percent of households. Modern technologies such as computers and cellular phones exhibit this same pattern, achieving widespread adoption in a relatively short time frame. Cellular phones have also replaced antiquated technologies like landlines, which declined from usage in about 95 percent of households in the early 2000s to just over 20 percent by 2023.
Other household technologies that require infrastructure, including indoor plumbing or air conditioning, display a more gradual adoption pattern than a rapid one over a longer time horizon, reaching nearly full saturation today as a necessity of daily living.
Energy, Economic Growth, and the Reality of Decoupling
The sustained increase in living standards discussed in the prior section coincides with a period of expanding energy use, reflecting the role of energy in enabling industrialization, capital formation, and technological progress. Indeed, as economies gain access to more abundant and reliable energy, they are able to produce more goods and services per person, supporting higher incomes and broader improvements in material well-being.
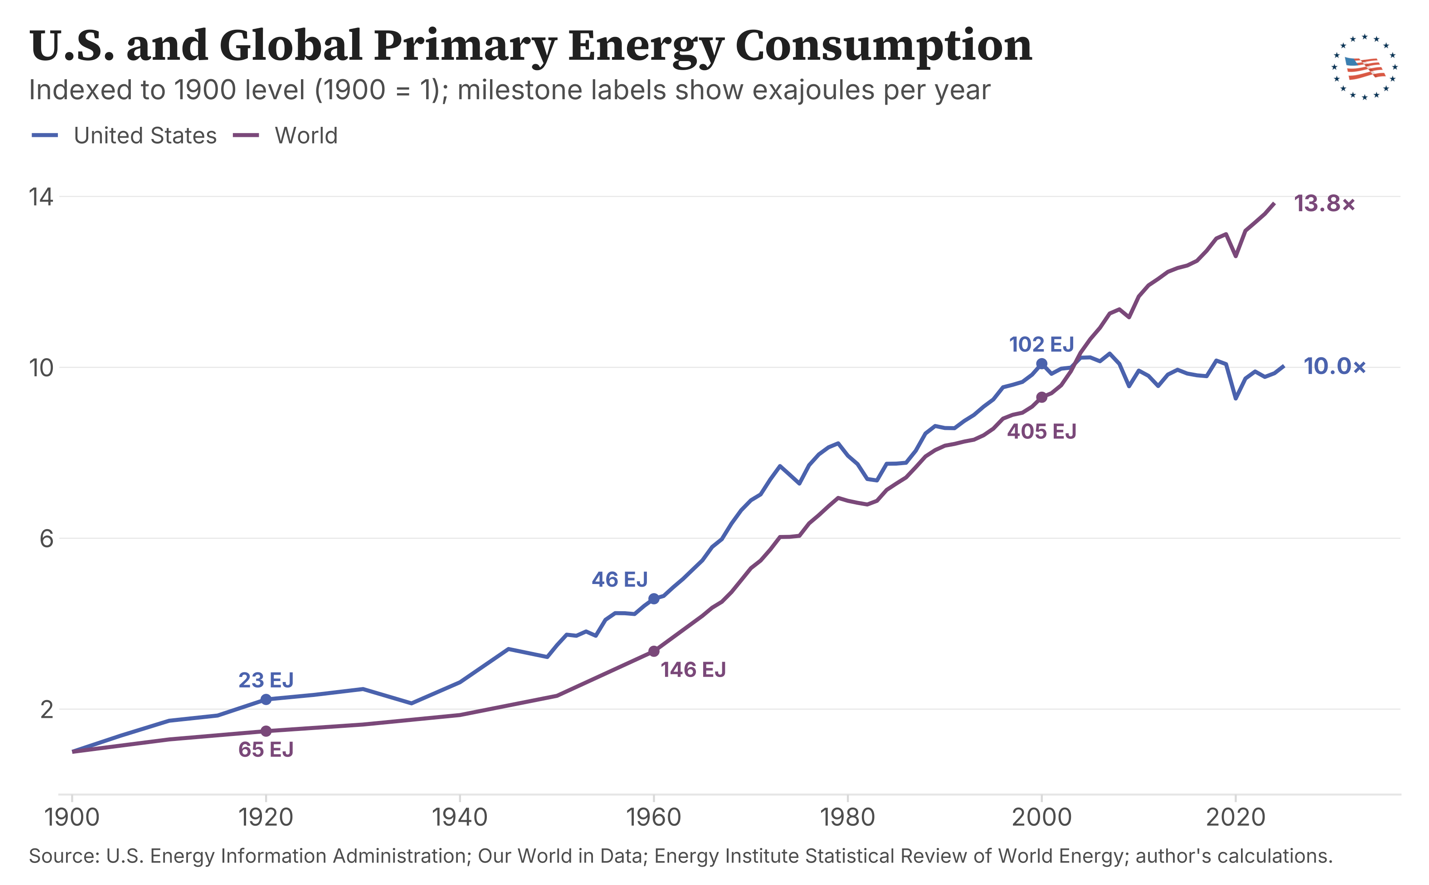
One of the most important features of the modern era is the dramatic rise in primary energy use. Figure 2 shows U.S. and global primary energy consumption from 1900 through the most recent year of available data, in exajoules (EJ) per year. U.S. consumption rose from roughly 10 EJ in 1900 to about 102 EJ today—about a tenfold increase over 125 years. Global consumption rose from roughly 44 EJ to about 603 EJ over the same period—a fourteenfold increase. Most of that rise occurred after World War II, as fossil fuels and electrification spread well beyond the early-industrial economies.
Figure 2
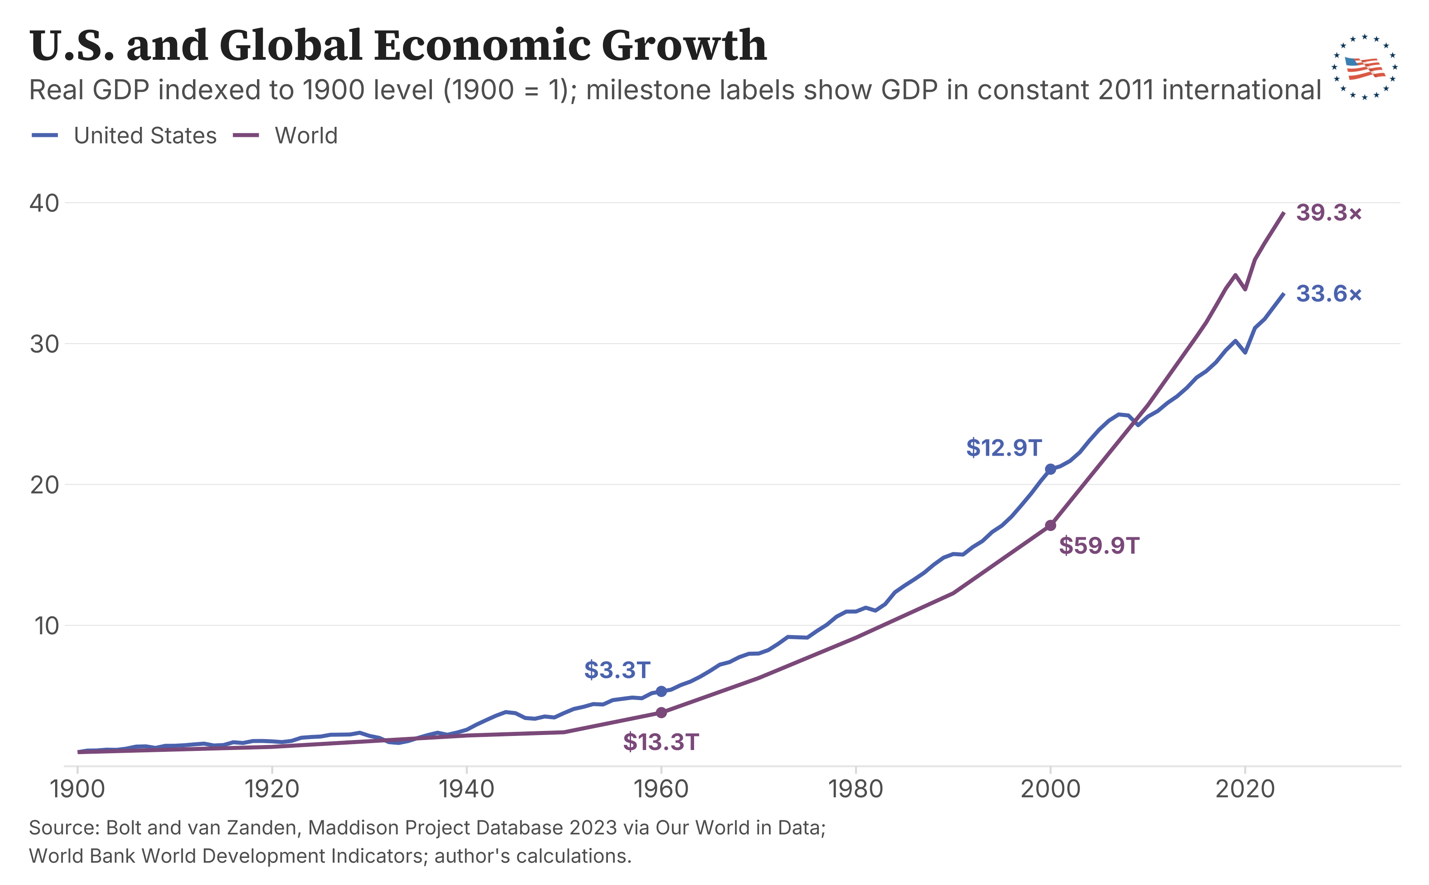
Real economic output rose alongside this energy expansion. Figure 3 shows U.S. and global real GDP from 1900 through the most recent year of available data, in trillions of constant 2011 international (PPP-adjusted) dollars. U.S. real GDP grew from roughly $0.6 trillion in 1900 to over $20 trillion today—more than a thirty-fold increase. Global real GDP grew from roughly $3.5 trillion to about $138 trillion over the same period—a nearly fortyfold increase. As with energy, most of the growth occurred in the second half of the twentieth century, with continued expansion through the early twenty-first.
Figure 3
Before turning to per capita measures, it is useful to look at the broader relationship between energy use and economic output and how it has evolved as economies have grown more efficient.
Figures 4a and 4b trace U.S. and global GDP against total primary energy consumption at ten-year intervals from 1900 through 2020. Both axes are log-scaled with equal log decades, so the geometry of the trajectory has a direct economic meaning. A 45° path on this figure corresponds to a one-to-one relationship between energy and economic growth—for every percent rise in energy use, GDP rises by the same percent. The gray dashed line on each panel marks that 1:1 reference. A path that climbs more steeply than the dashed line means GDP grew faster than energy — that the economy got more output from each unit of energy over time.
Figure 4a
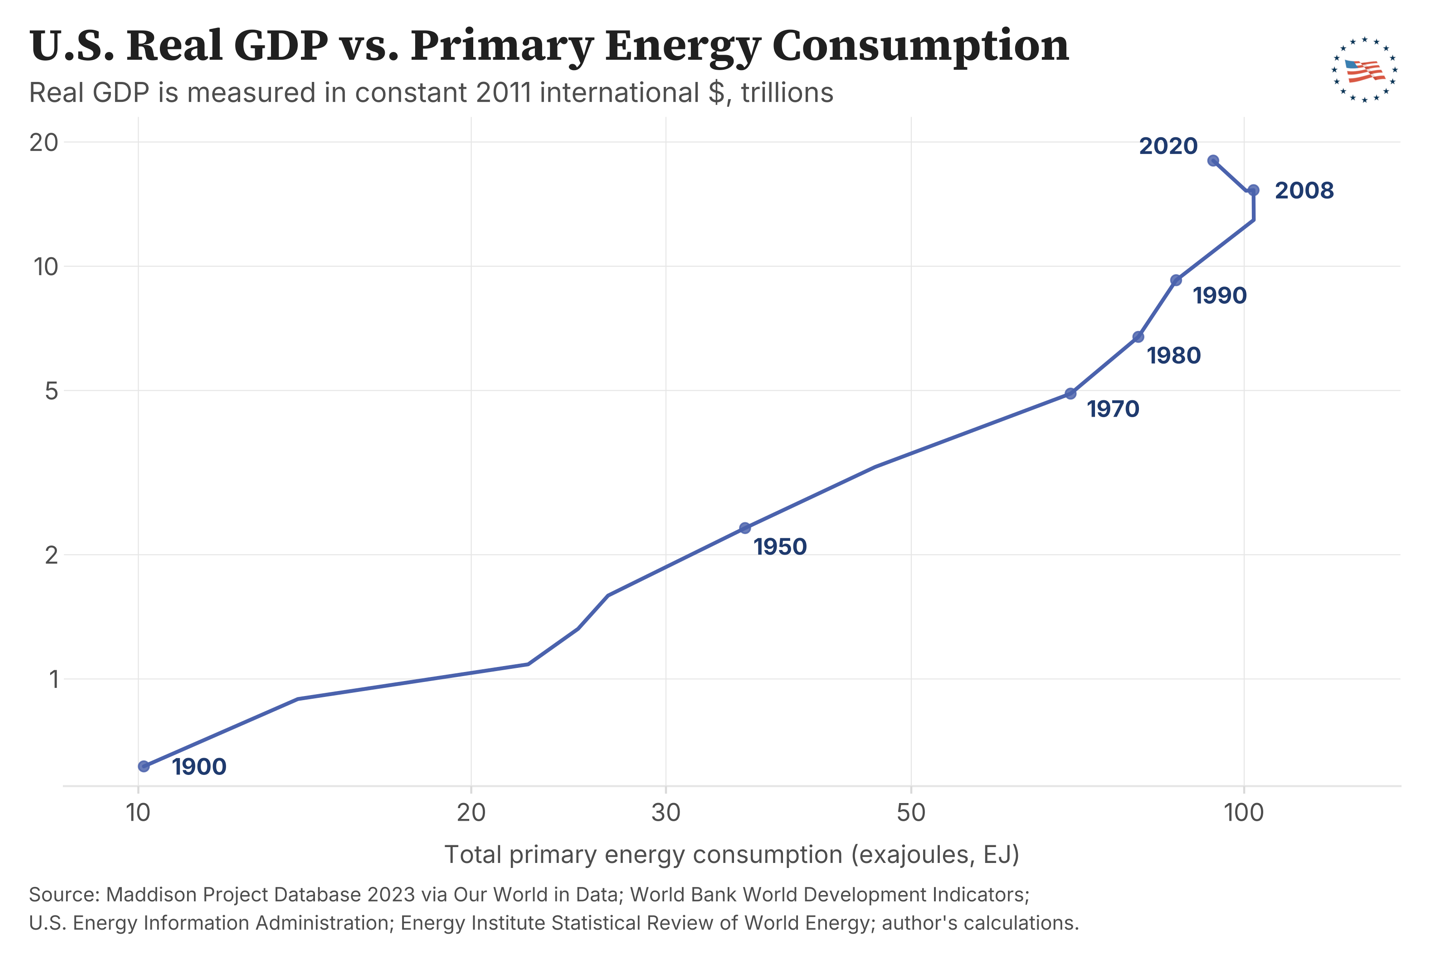
Figure 4b
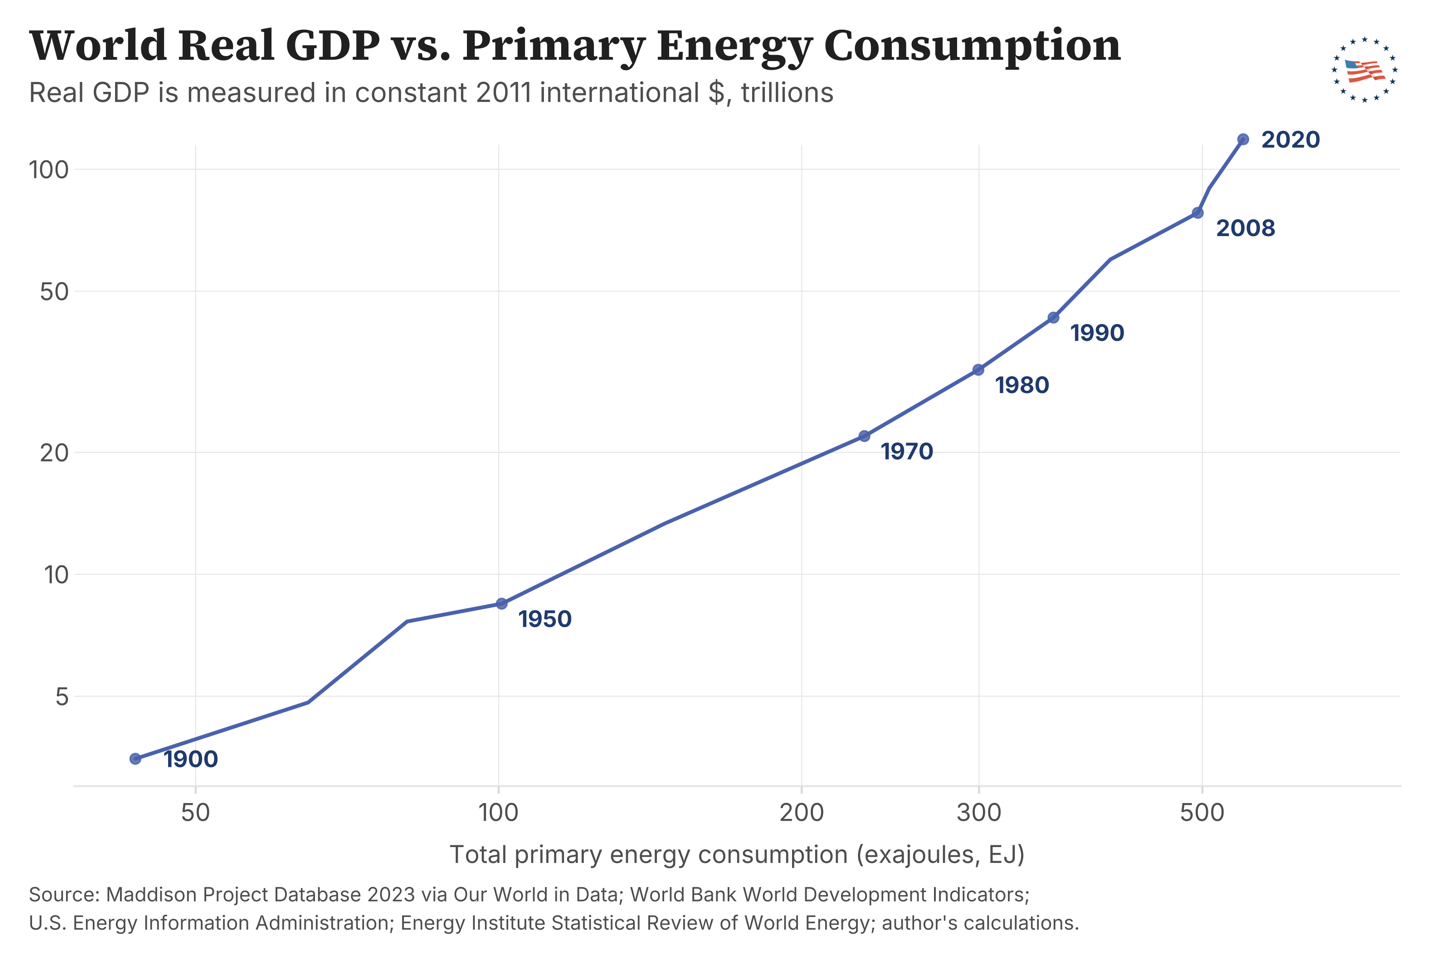
Globally, the path climbs steadily across the entire twentieth century and remains well above the 1:1 reference throughout. Energy use rose from about 44 EJ in 1900 to roughly 590 EJ in 2020—a fourteenfold increase—while real global GDP grew from about $3.5 trillion to about $119 trillion, more than a thirtyfold increase. Each unit of energy now produces roughly 2.4 times more GDP at the global level than it did in 1900. Growth accelerated after World War II as industrialization spread beyond the early-industrial economies, and this path steepens further after 2000.
The United States, however, has a slightly different story. Through the postwar decades, energy use and GDP grew roughly in tandem—by 1970 the U.S. consumed about seven times as much primary energy as in 1900 and had similar multiples of GDP growth. After the 1973 OPEC oil embargo and the 1979 Iranian Revolution, U.S. energy growth slowed materially relative to GDP growth, and after the 2008 financial crisis the trajectory turns nearly vertical: U.S. primary energy consumption peaked near 100 EJ that year and has flattened or slightly declined since, while real GDP has climbed past $18 trillion. Each unit of energy in the U.S. now produces about 3.1× more GDP than it did in 1900, and 2.7× more than in 1970—the bulk of the decoupling occurred in the post-oil-shock regime.
The pattern becomes more apparent when real GDP and primary energy consumption are rebased to a common starting year and tracked as multiples since as can be seen in Figure 5.
Figure 5a
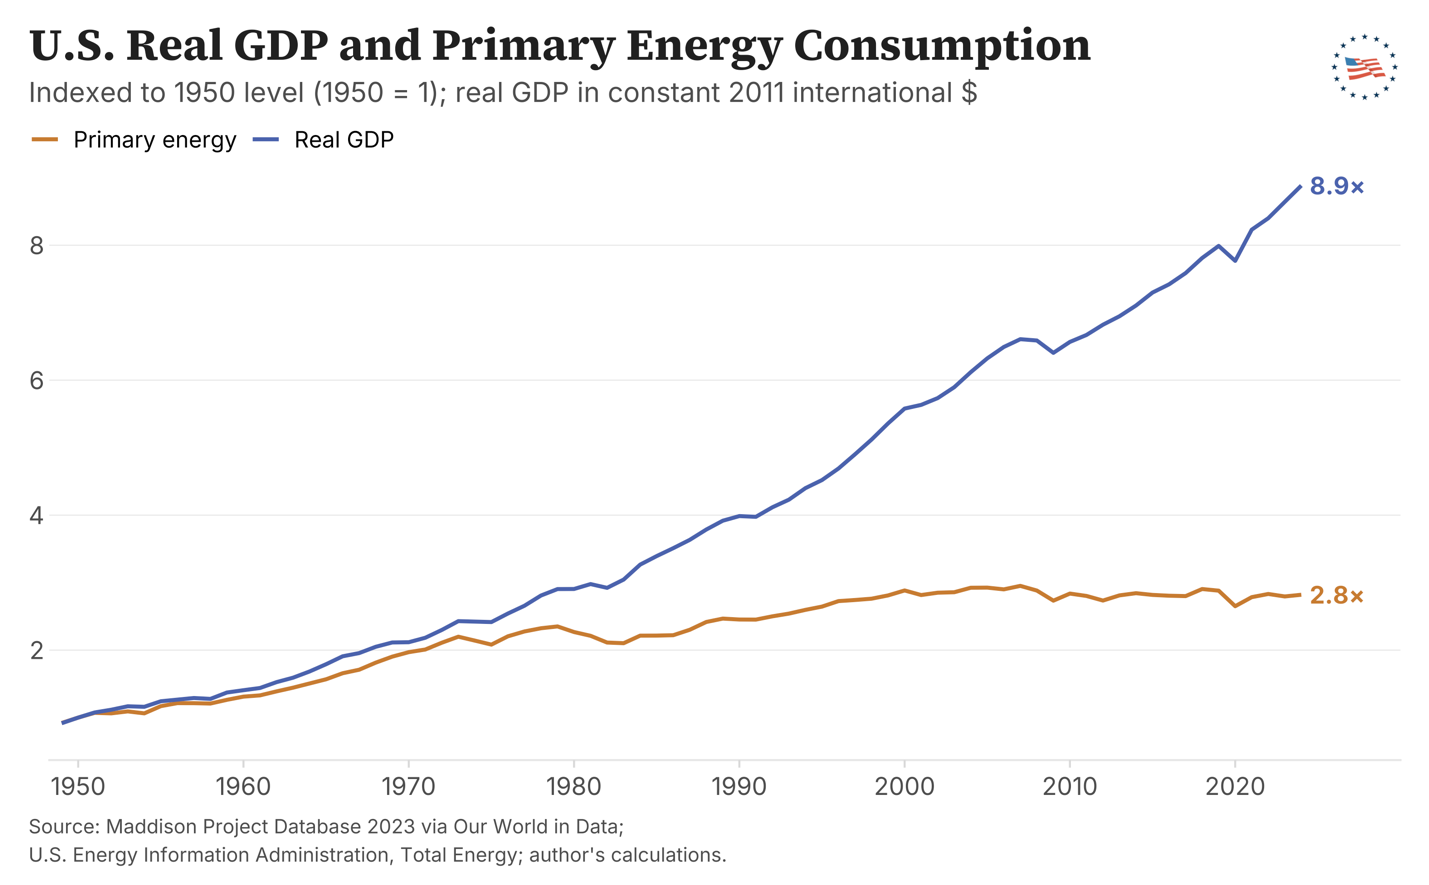
Figure 5b
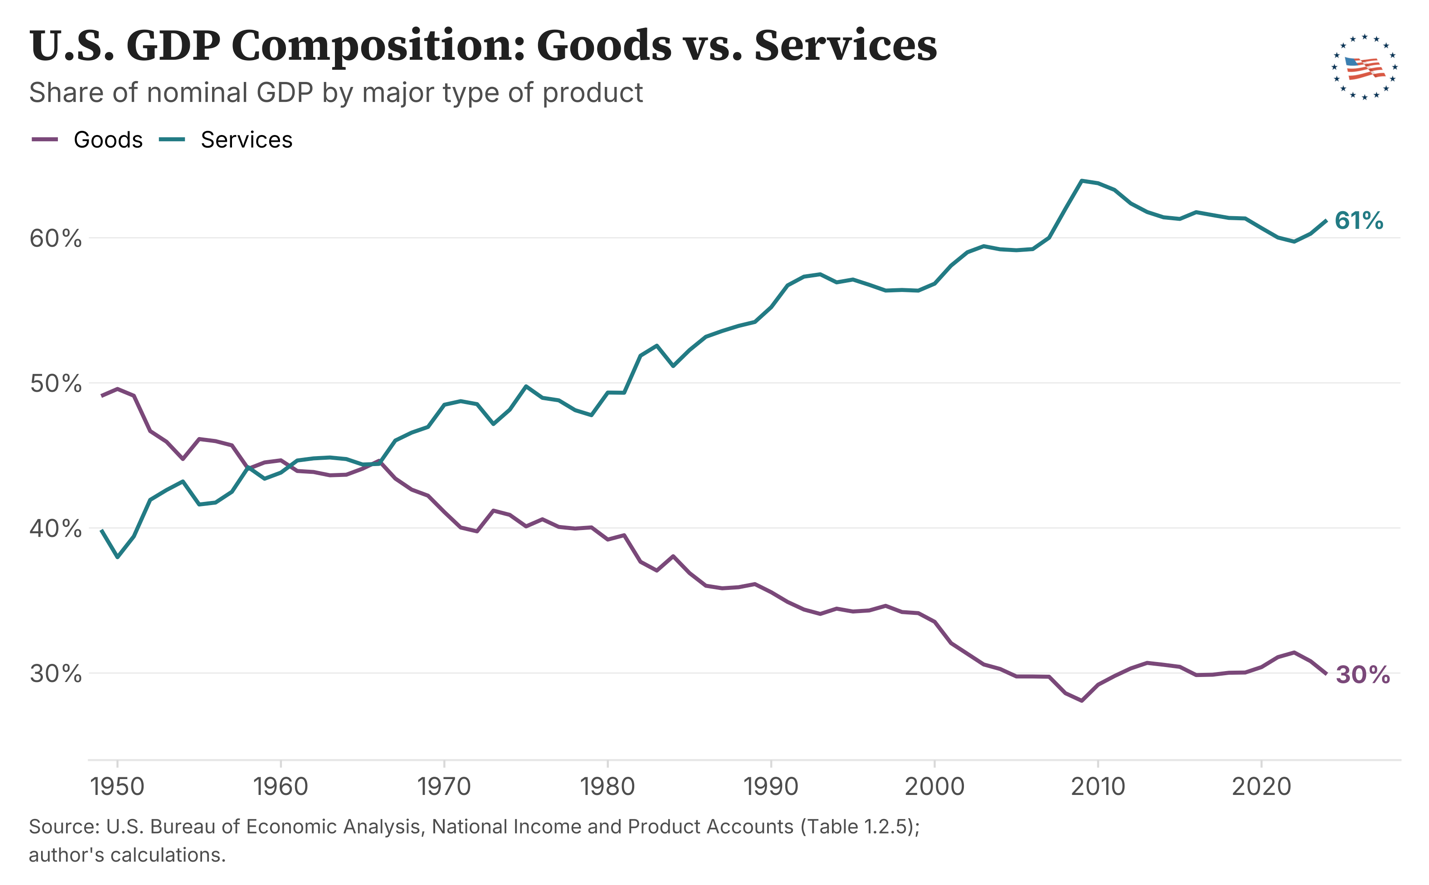
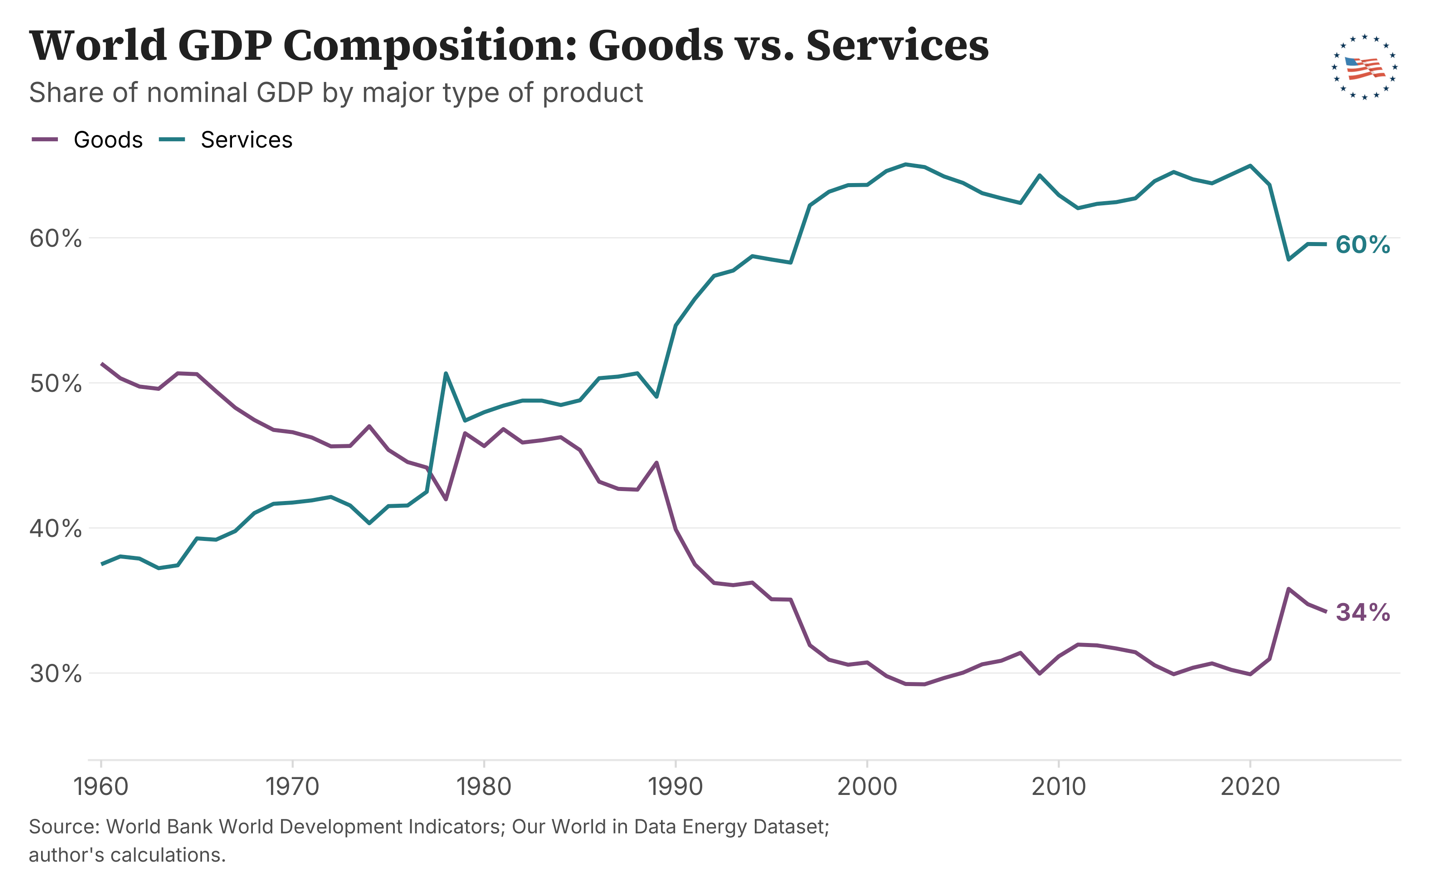
As Figure 5a shows, in the United States, real GDP rose roughly 9.5-fold between 1950 and 2024, while primary energy use rose 2.8-fold—a unit of energy now supports more than three times as much economic output as it did in 1950. Some may read this decoupling to mean that “more energy no longer matters;” however, two distinct forces drive it and neither supports that reading. The first is genuine efficiency gain: each unit of energy now yields substantially more output than it did at midcentury. The second is structural—the composition of U.S. GDP has shifted markedly toward services and away from the energy-intensive goods-producing sectors that historically dominated the economy, so a substantial portion of the apparent decoupling reflects the relative shrinkage of those heavy-energy sectors, domestically, rather than a reduced need for energy itself. U.S. consumers still rely on energy-intensive goods that are increasingly produced abroad and imported.
Despite that energy consumption occurring abroad, it is still crucial to the U.S. economy. However, even after accounting for both the effects of increasing efficiency and the expanding domestic services share of output, U.S. energy consumption still nearly tripled over the period in absolute terms. A similar pattern is depicted in Figure 6a, albeit less pronounced, at the global level as well. Figure 6b reflects this U.S. decoupling alongside the goods-to-services compositional shift that drives much of it.
Figure 6a
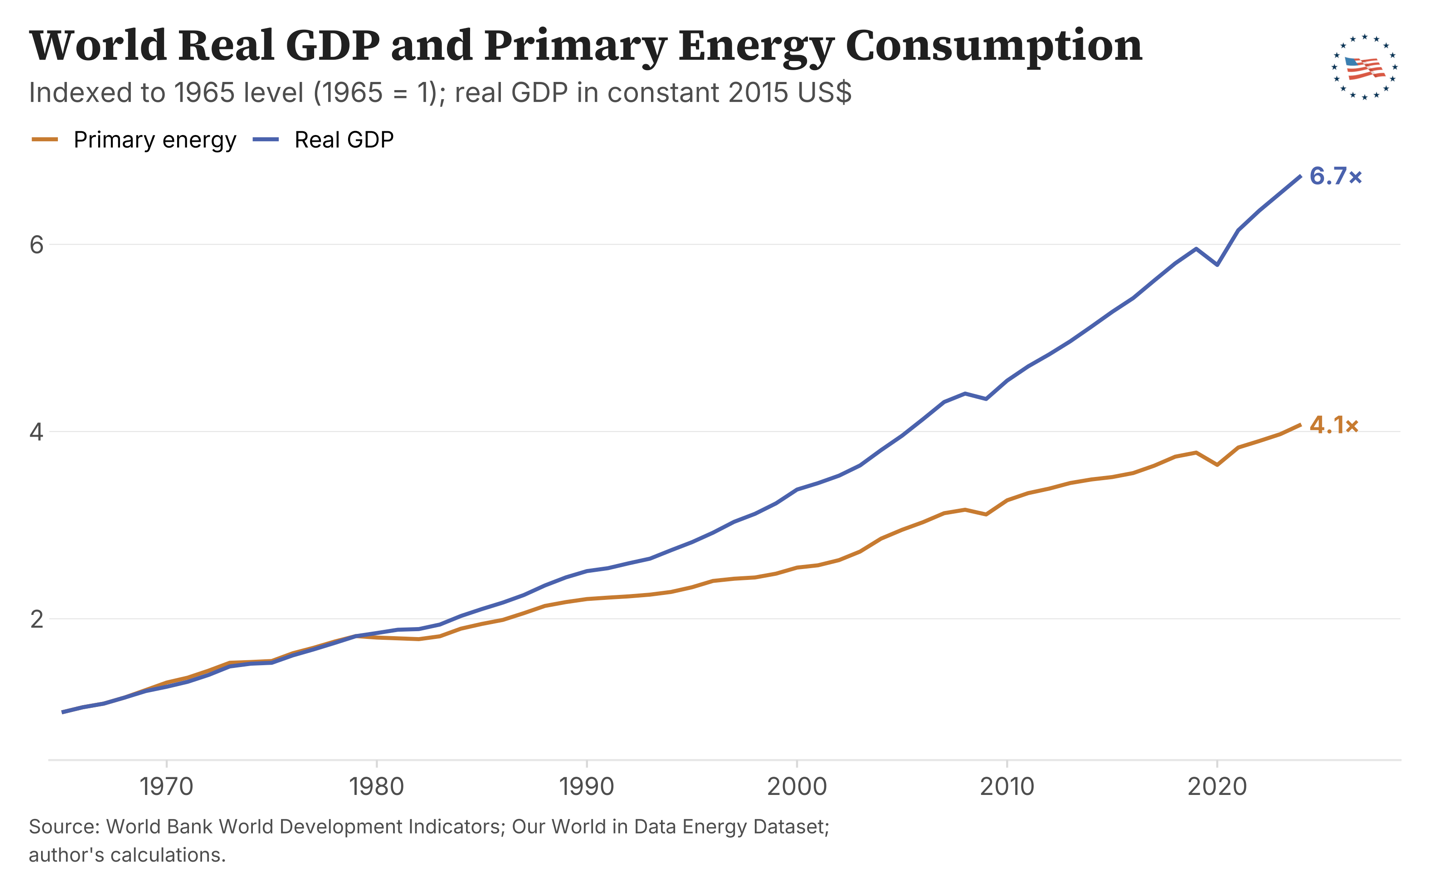
Figure 6b
As can be seen in Figure 6a, world real GDP grew approximately 6.7-fold between 1960 and 2024, while primary energy consumption (available in this dataset from 1965 onward) grew about 4.1-fold. This decoupling reflects shifts in the composition of output—a larger services share, more efficient industrial processes, and improvements in energy intensity per unit of GDP—rather than a decline in the importance of energy itself.
There is a significant degree of heterogeneity across the globe in terms of the nature of this decoupling. Figure 7a and Figure 7b break down this decoupling across developed and developing countries as defined under World Bank income classification.[2]
Figure 7a
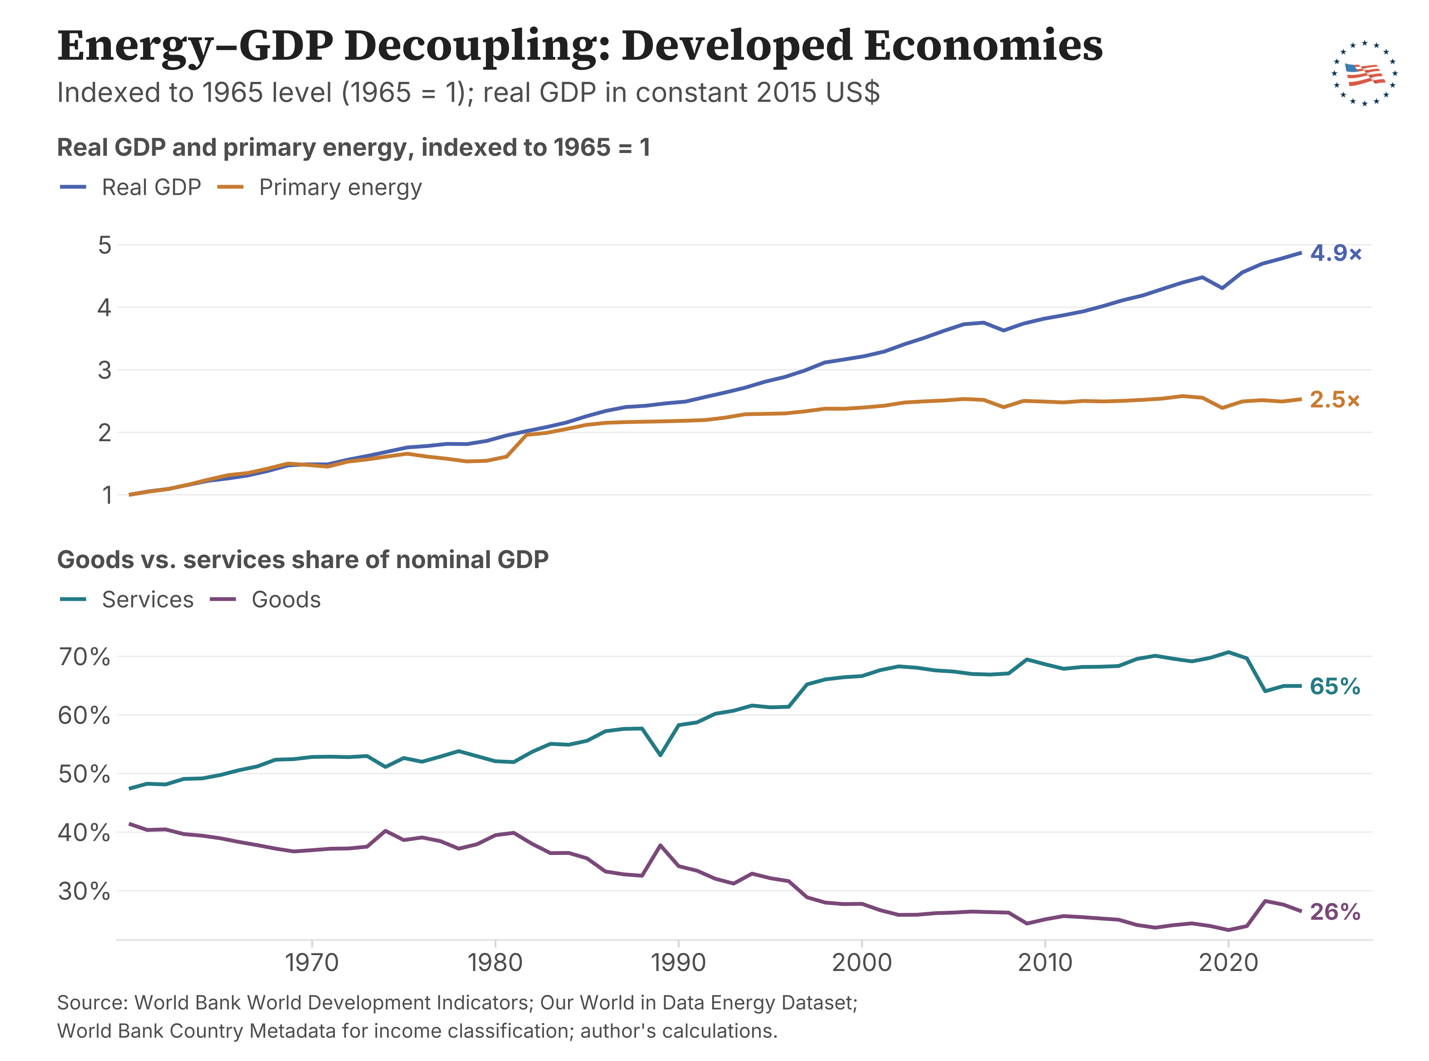
Figure 7b
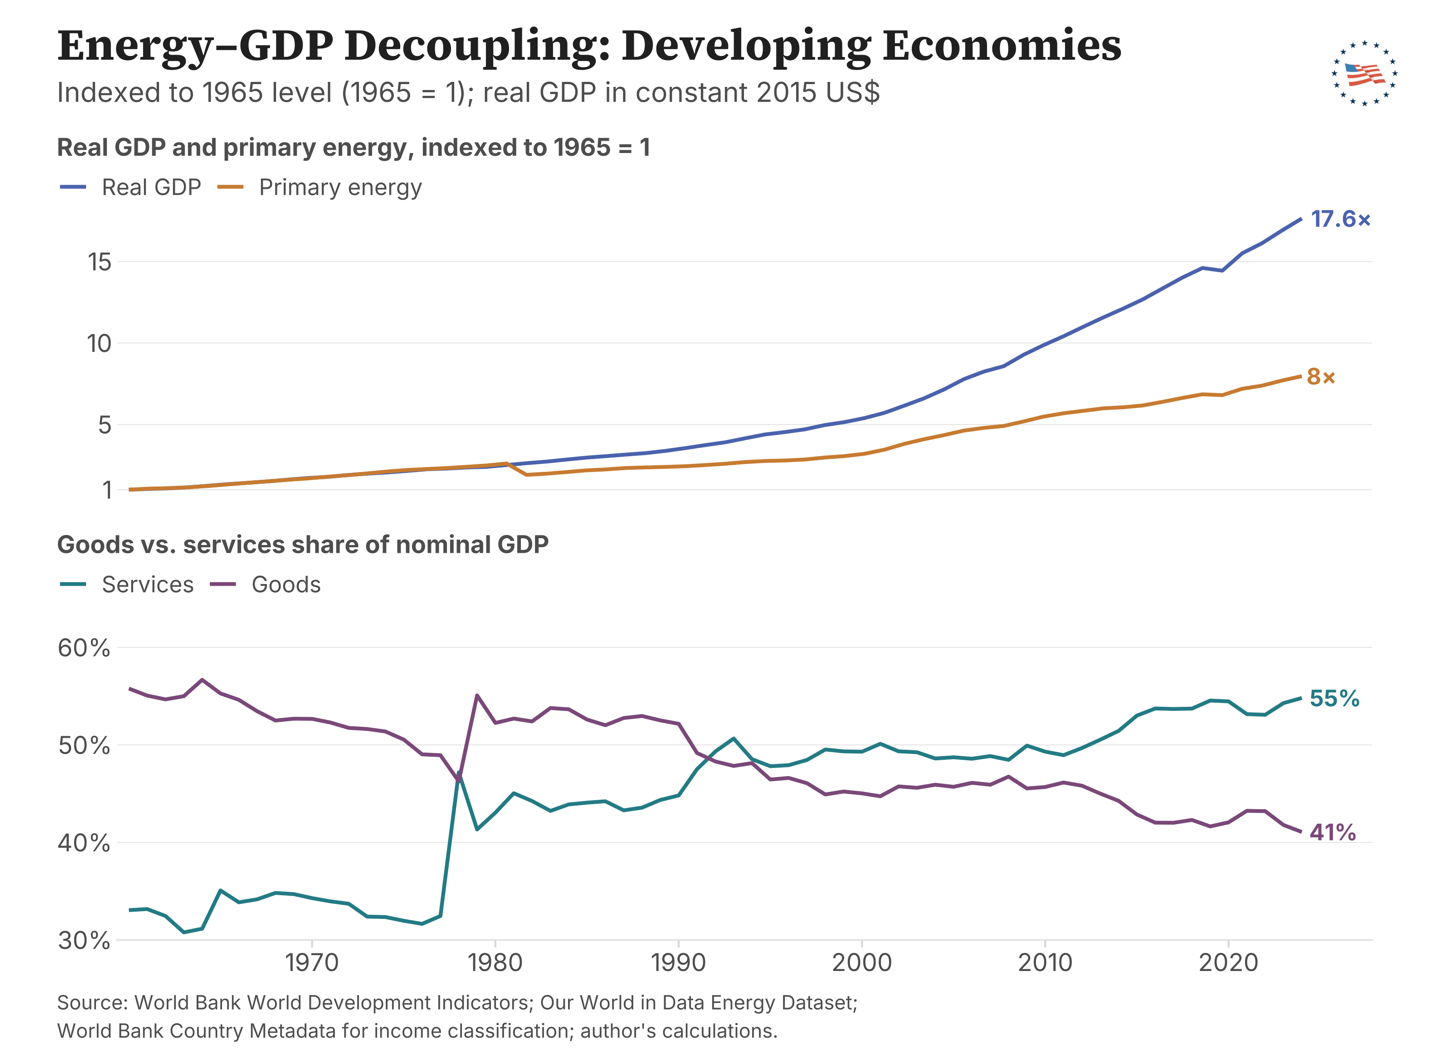
As Figure 7a illustrates, in high-income (developed) economies—defined by higher per capita income—real GDP since 1960 has grown 4.9-fold while energy use grew only 2.5-fold. In developing economies—those with lower per capita income—by contrast, real GDP grew much more rapidly—17.6-fold—alongside an 8.0-fold increase in energy use, increasing from about roughly $2.1 trillion to $37.1 trillion, with energy use rising from approximately 12,300 TWh to roughly 98,200 TWh. The pattern indicates that decoupling is most evident in already-industrialized economies, while developing economies are still in the energy-intensive phase of growth, where additional energy use translates fairly directly into additional output.
This pattern is best understood developmentally rather than as a divergence in how energy and economic growth relate. Developed economies' lower energy intensity reflects a later stage of the same process developing economies are now traversing: energy-intensive industrialization built the manufacturing base, transportation networks, electrical grids, and capital stock on which a services-heavy economy can subsequently rest. The services and information sectors that dominate U.S. output today are not energy-light in any absolute sense—they depend on industrial inputs produced elsewhere, on continuously powered digital infrastructure, and on the built environment that earlier energy-intensive growth made possible. Viewed this way, the U.S. trajectory through roughly 1970 looks much like the developing-country pattern visible today, and the apparent decoupling that followed is the destination of that earlier path rather than an alternative to it.
With this backdrop—substantial economic growth supported by, but not proportional to, energy use—the key insight is not that energy has become less important, but that economies have become more efficient in how they use it. Each unit of energy today supports significantly more output than in the past, a clear manifestation of both technological progress and structural economic change. Far from weakening the link between energy and prosperity, this pattern underscores how central energy remains to modern economic life—even as its use becomes more productive.
This distinction motivates the next step in our analysis. While aggregate trends highlight how energy and output evolve together over time, per capita measures provide a clearer view of how energy translates into improvements in individual well-being. The following section therefore turns to income and productivity, examining how energy use relates to per capita GDP, labor, industrial, and agricultural productivity across both time and countries.
Energy, Income, and Productivity
While global energy consumption has grown substantially over the past century, these aggregate trends obscure large differences across countries. Energy use per person varies widely around the world, and these differences are closely tied to disparities in income and productivity.
The following figures present both time series and cross-country scatter plots comparing per capita energy consumption with key measures of economic well-being, including per capita GDP as well as labor, industrial, and agricultural productivity. Each is shown on a logarithmic scale, allowing for meaningful comparisons across countries at vastly different levels of development. On this scale, proportional increases are comparable—for example, moving from 1,000 to 10,000 units represents the same relative change as moving from 10,000 to 100,000. These comparisons provide a framework for assessing how differences in energy use align with differences in economic outcomes across countries.
Among the measures considered here, the link between energy use and income is the most direct. Higher levels of energy consumption are consistently associated with higher per capita GDP—both within countries over time and across countries at a point in time—because energy is a fundamental input to production that raises the output obtainable from labor and capital. At the same time, rising incomes in turn finance further energy use. Figure 8a depicts per capita GDP over time and Figure 8b shows energy consumption on a country-by-country basis. In this and subsequent country level plots, x-axis units are in gigajoules (GJ).
Figure 8a
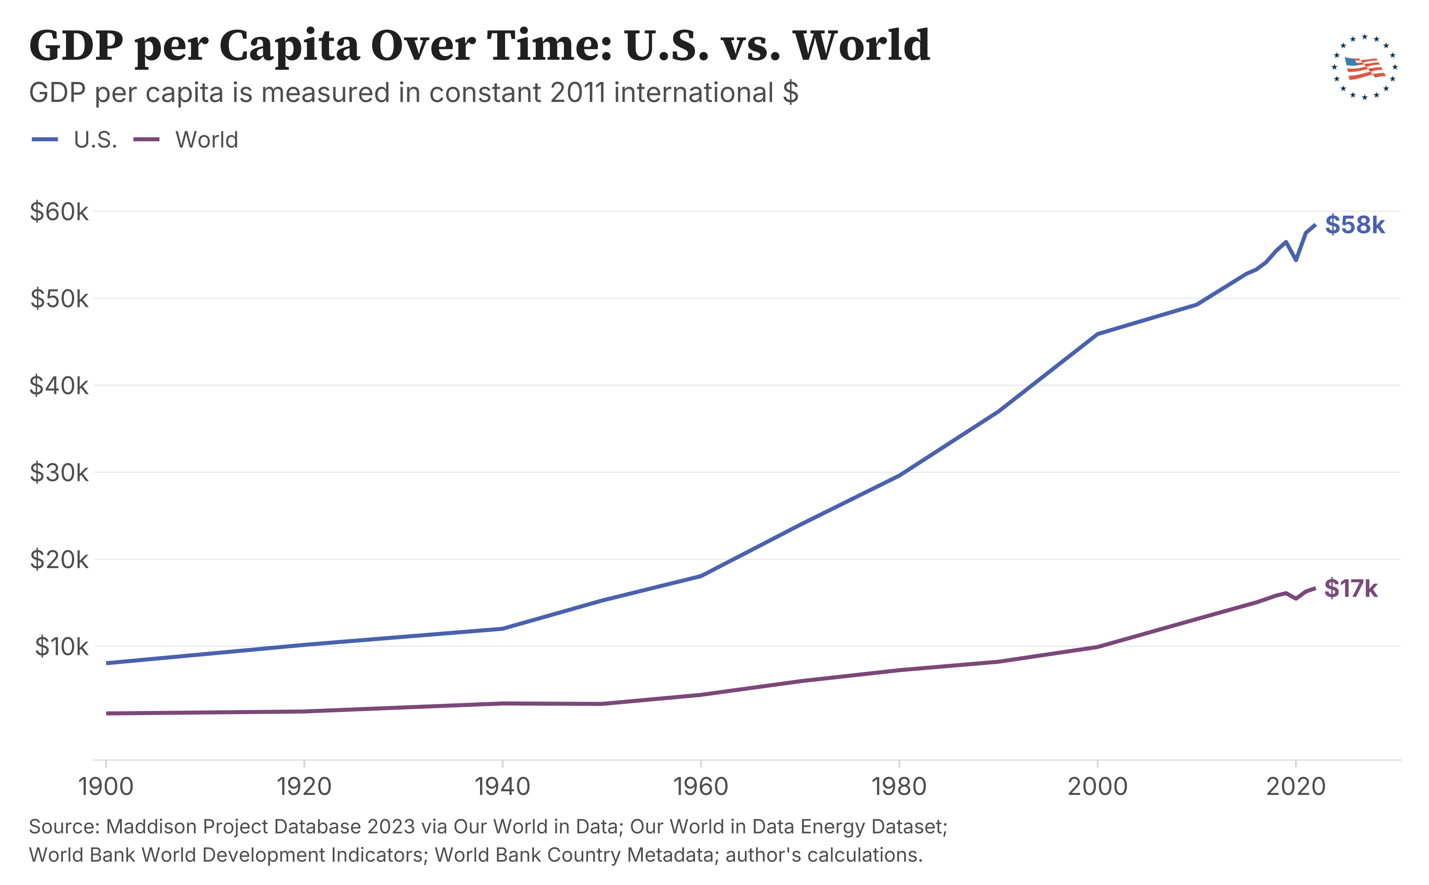
Figure 8b
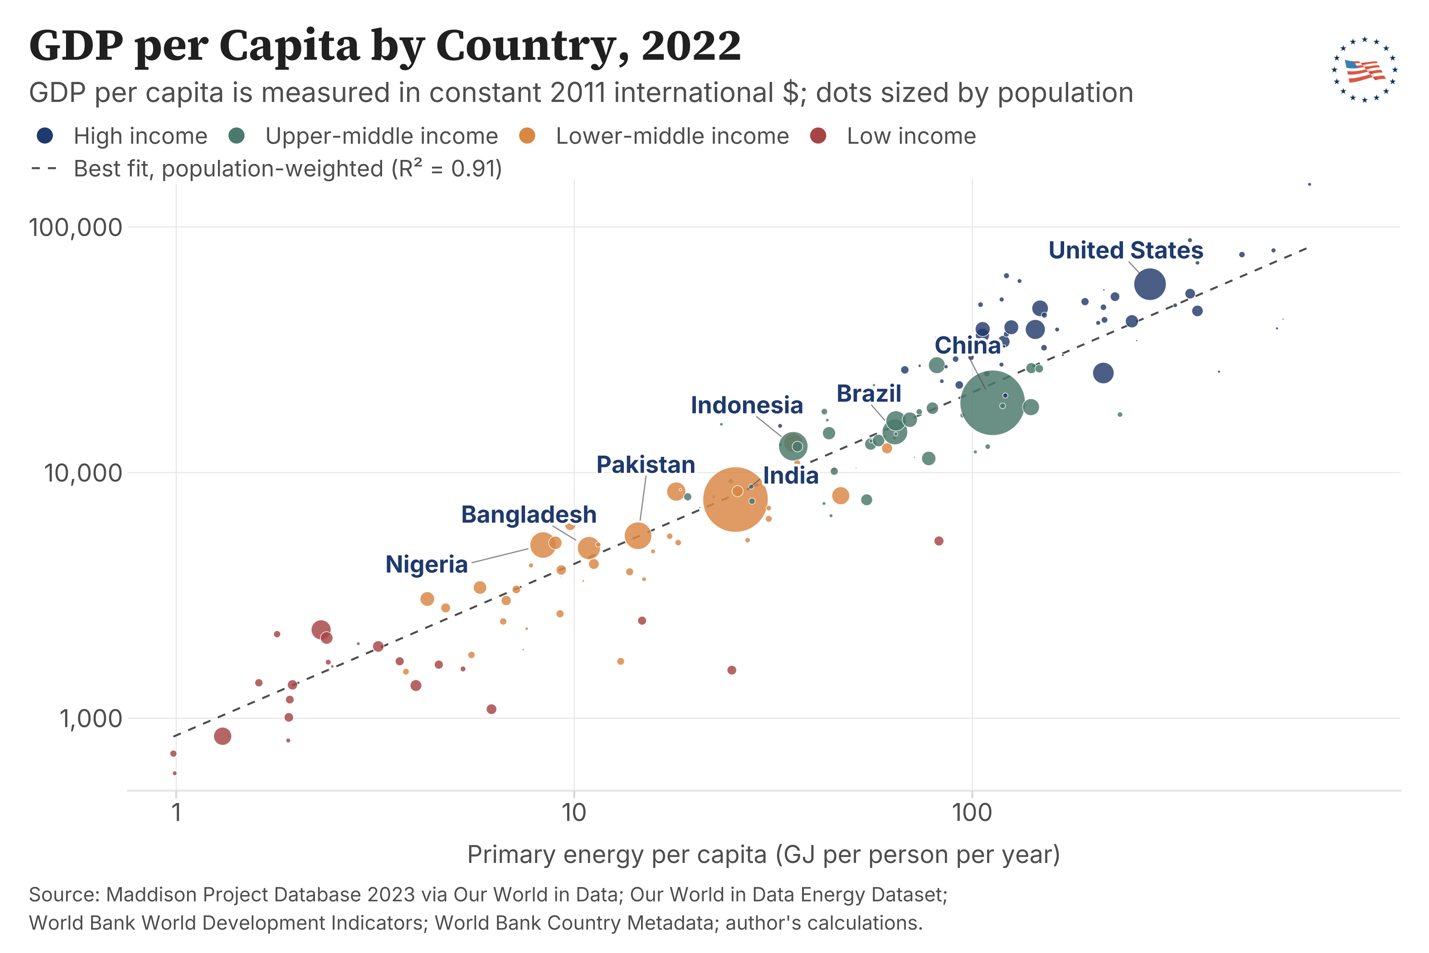
As can be seen in Figure 8a, there has been a dramatic rise in income per capita over the past century at both the global level and in the United States. From 1900 to 2022, real global GDP per capita rose from about $2,300 to about $16,700 (in international 2011 dollars), which is more than a sixfold increase. The United States also experienced massive growth, where per capita income increased from about $8,000 to nearly $60,000.
Figure 8b also shows the relationship between per capita energy consumption and per capita GDP across countries in 2022. There is a strong positive relationship, where countries with low energy consumption typically have low levels of income, whereas countries with high energy consumption have significantly higher incomes. For example, countries that use only a few hundred to a few thousand kilowatt hours (kWh) per capita tend to have subsistence-level production of around $1,000 to $3,000 per year. On the other hand, countries that use tens of thousands of kWh per person, such as the United States and Norway, have significantly higher income.
Access to affordable energy also enables firms to generate more output from the same labor and capital inputs. Figure 9a quantifies this concept, depicting labor productivity in the United States, measured as output (in international 2021 dollars) per hour worked:
Figure 9a
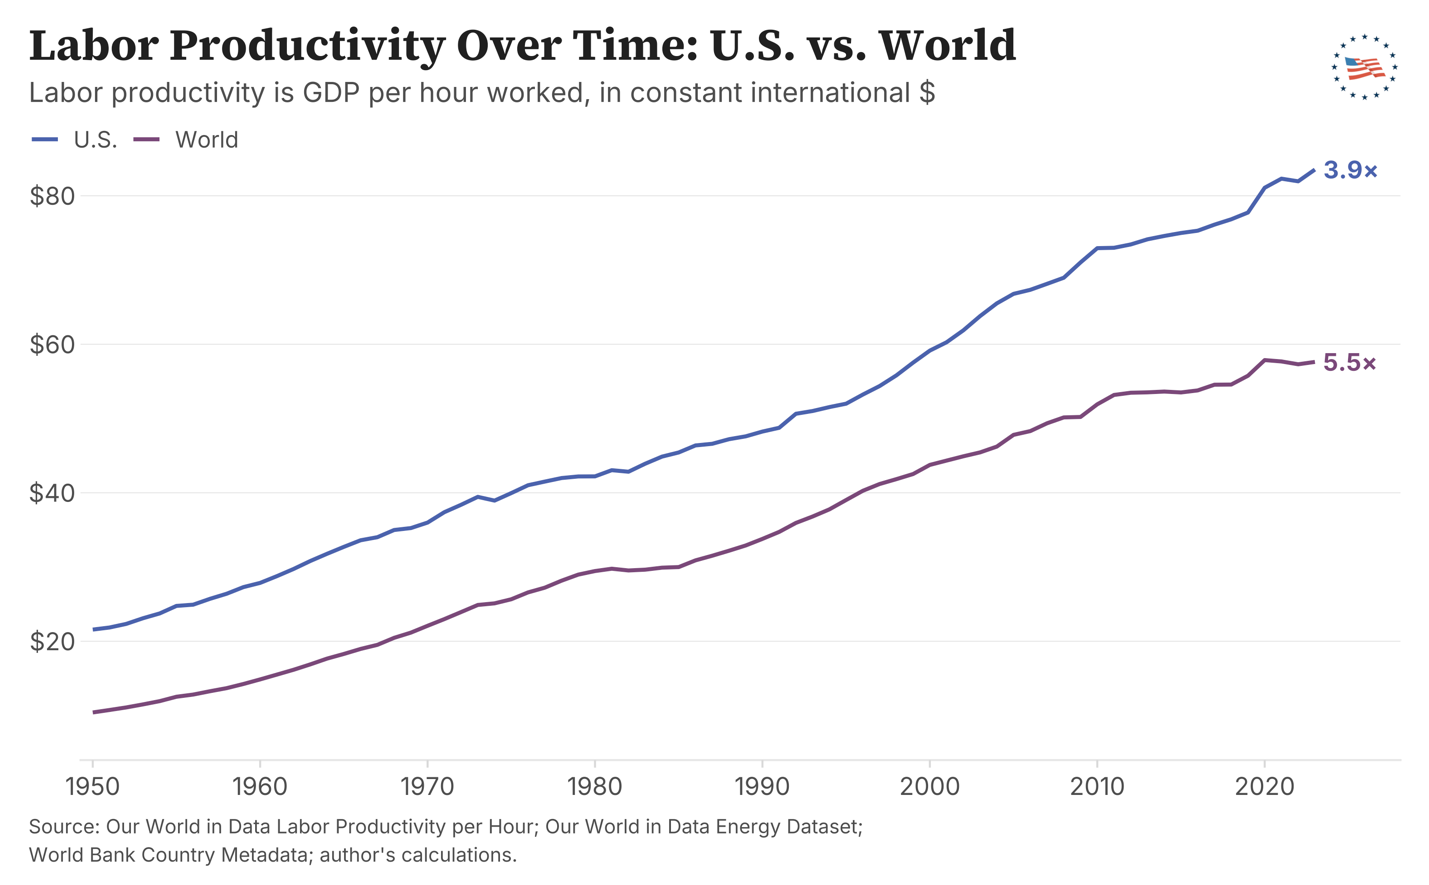
As Figure 9a shows, from 1950 to 2023, productivity rose from roughly $22 per hour to over $80 per hour, an increase of nearly 300 percent. As Figure 9b also shows on a cross-country basis, there is a strong positive relationship, where countries with higher energy consumption exhibit greater productivity than countries that consume less energy. For example, the United States uses nearly four times more energy per person than Brazil and produces about four times as much output per hour worked. The United States also uses over one hundred times more energy per person and achieves approximately twenty times higher labor productivity compared to countries such as Ethiopia that have lower levels of energy consumption.
Figure 9b

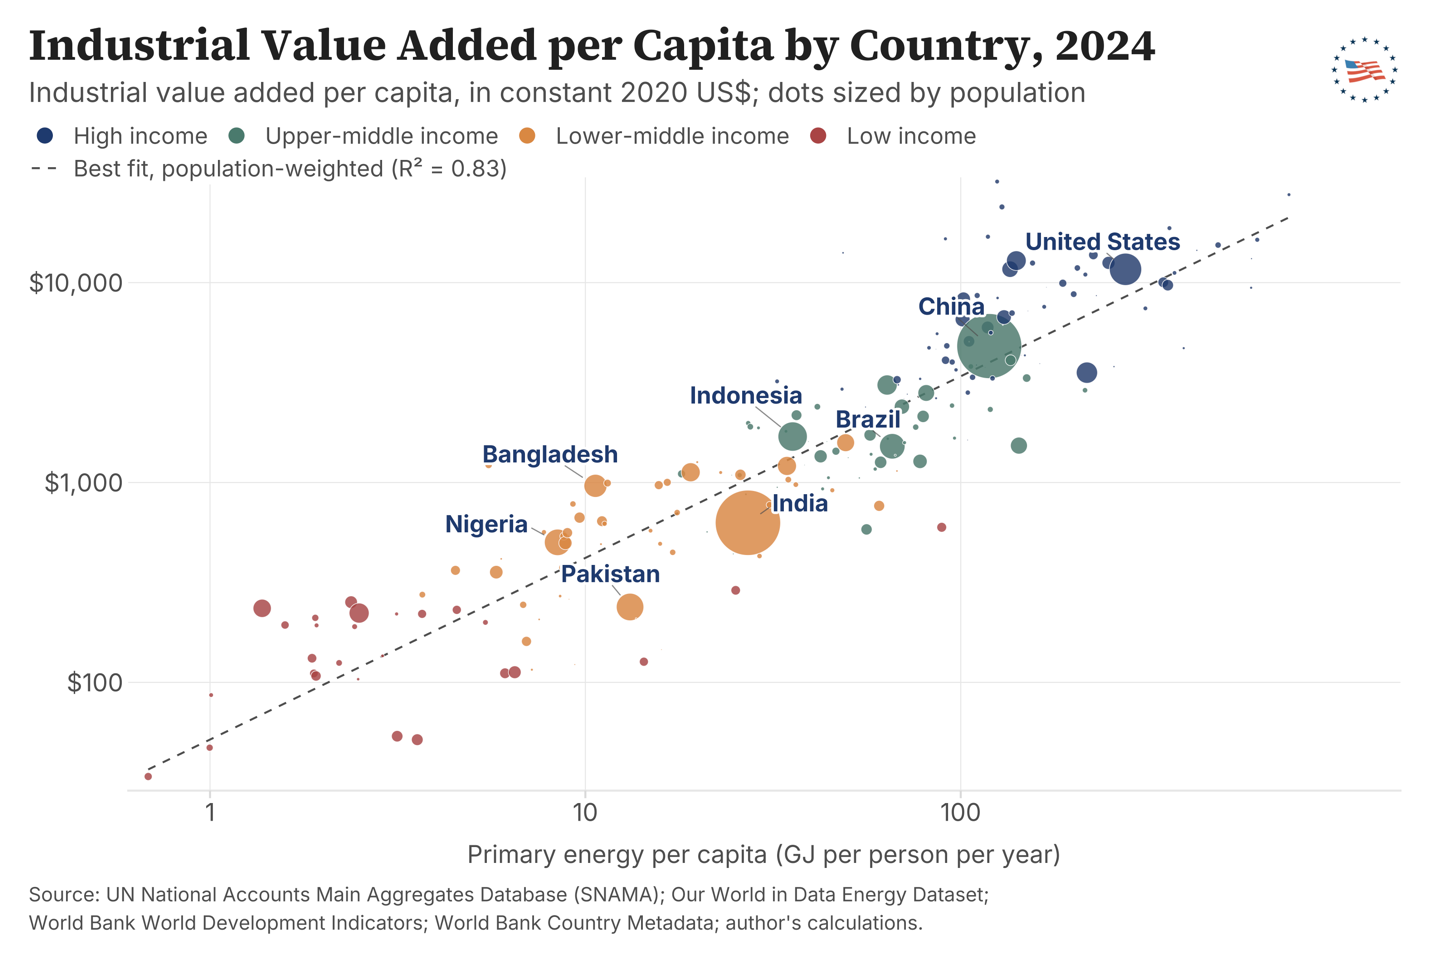
Labor productivity measures output per hour of work across the entire economy. A related measure—industrial value added per capita—isolates output from mining, manufacturing, construction, and utilities. Because these sectors are particularly energy-intensive, the link between energy and output should be particularly pronounced, rendering industrial value added a cleaner test of how energy access translates into industrial capacity.
Figure 10a plots U.S. and world industrial value added per capita over time, in constant 2020 U.S. dollars. The U.S. has consistently produced about three to four times as much industrial output per capita as the world average. In particular, from 1970 to 2024, U.S. industrial output per capita rose from roughly $8,700 to $11,700, while the world average rose from about $1,750 to $3,100—global industrial output per person nearly doubled. The cross-country panel of the same figure confirms the strong positive relationship between primary energy use per capita and industrial value added per capita: the population-weighted log-log fit yields R² = 0.84. Countries that consume tens of gigajoules of primary energy per capita per year tend to produce a few thousand U.S. dollars of industrial output per person, while countries consuming hundreds of gigajoules per capita produce tens of thousands of dollars of industrial output per person. A few small, high-income outliers—Ireland, Qatar, Switzerland, Norway, Denmark—sit above the fit line, reflecting concentration in particularly capital and energy-intensive industrial niches.
Figure 10a
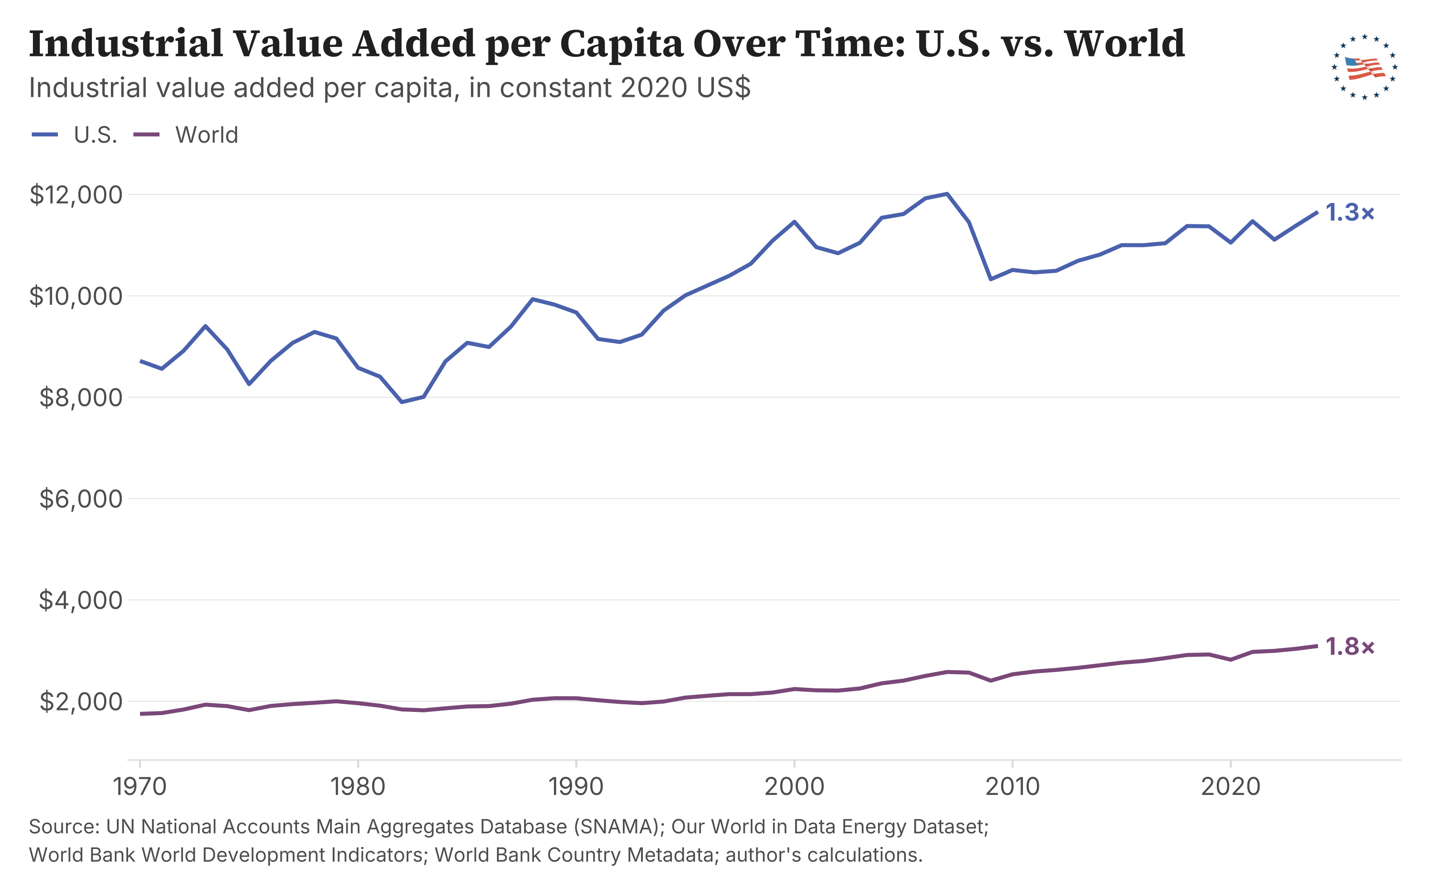
Figure 10b
Agriculture provides another clear example of how energy drives human advancement. Greater access to energy enables mechanization, improves inputs, and increases efficiency, leading to substantial gains in crop yields over time. The following figures show these trends both historically and across countries. Figures 11a, 11b, 11c, and 11d depict changes in corn and wheat yields over time.
Figure 11a
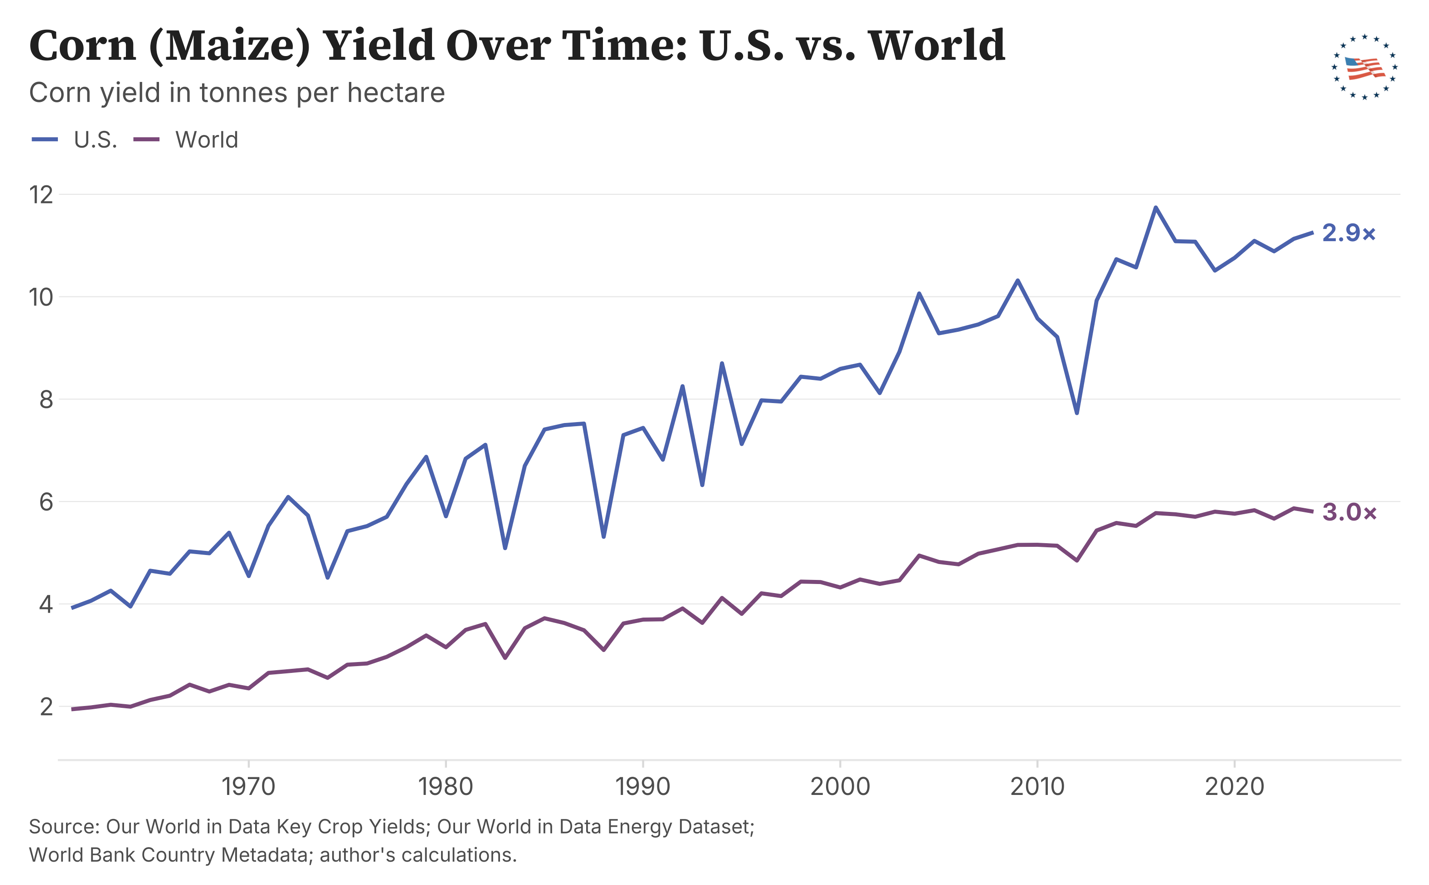
Figure 11b
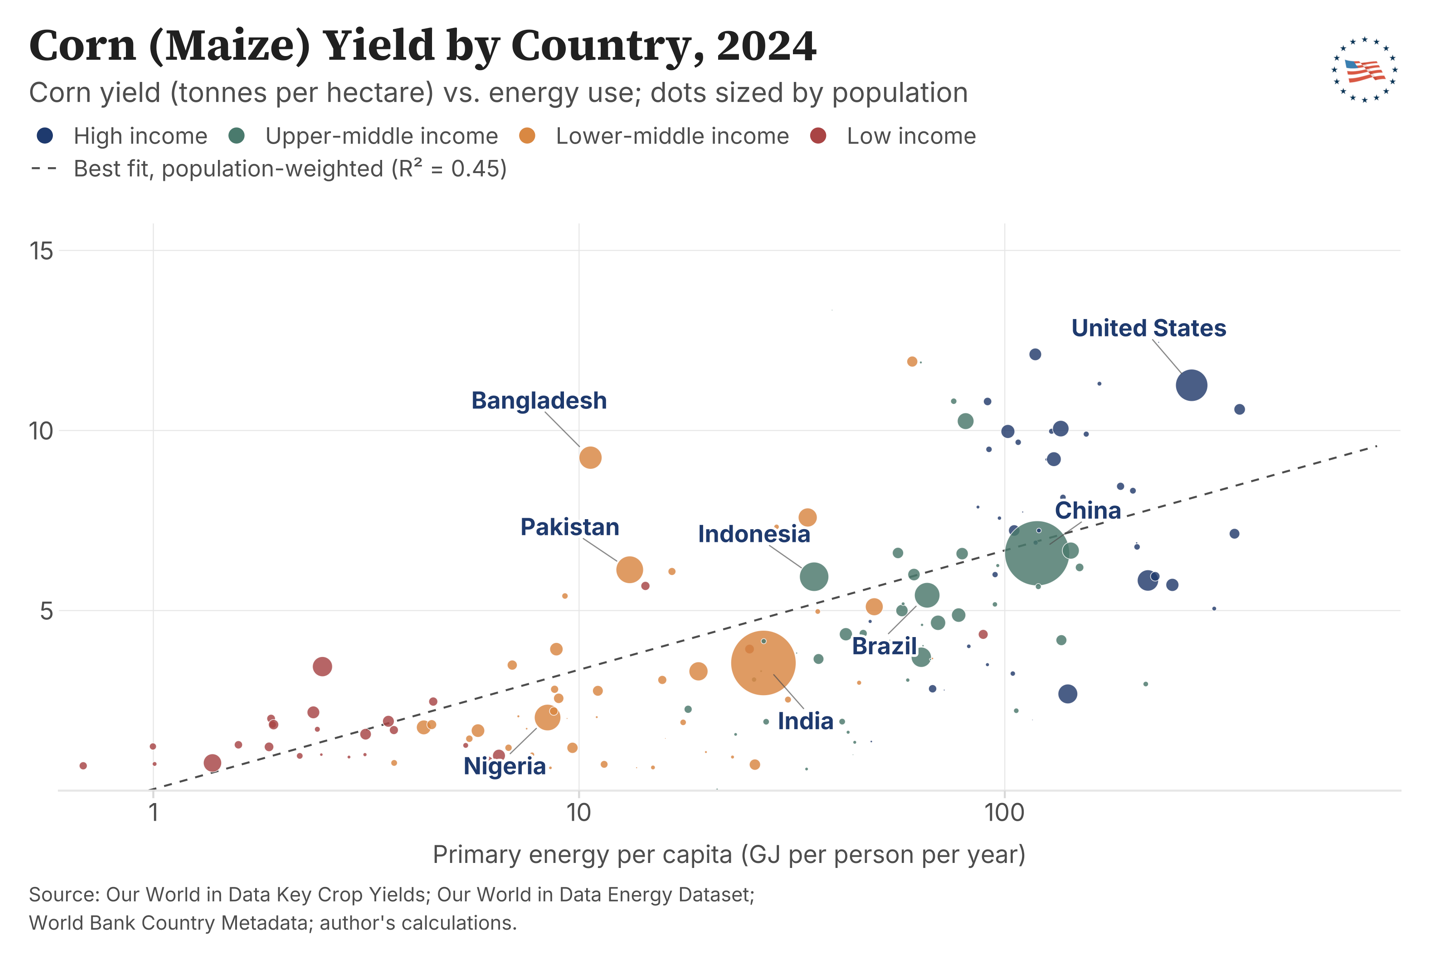
Figure 11c
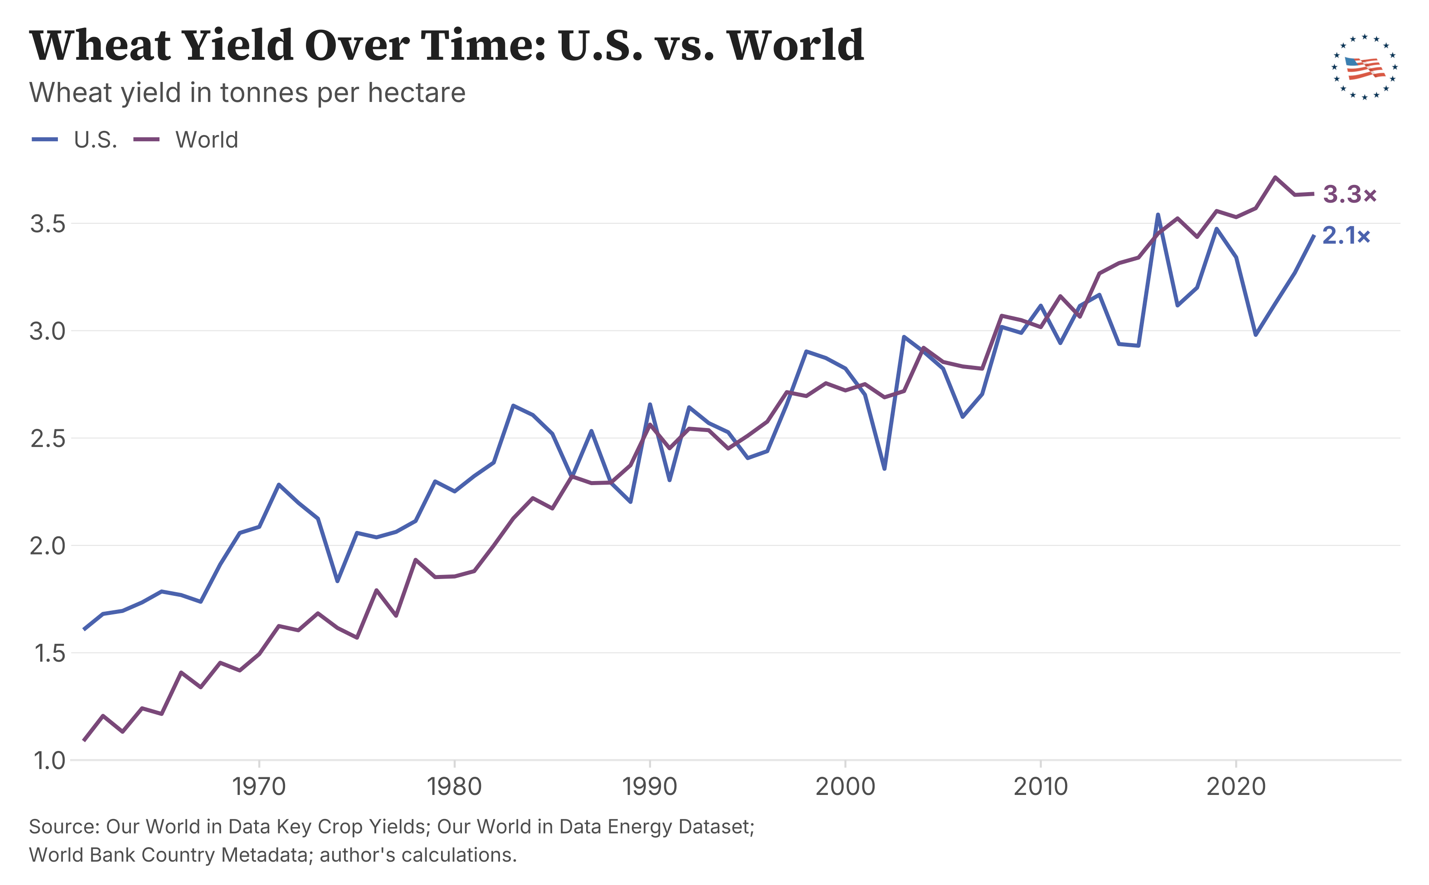
Figure 11d
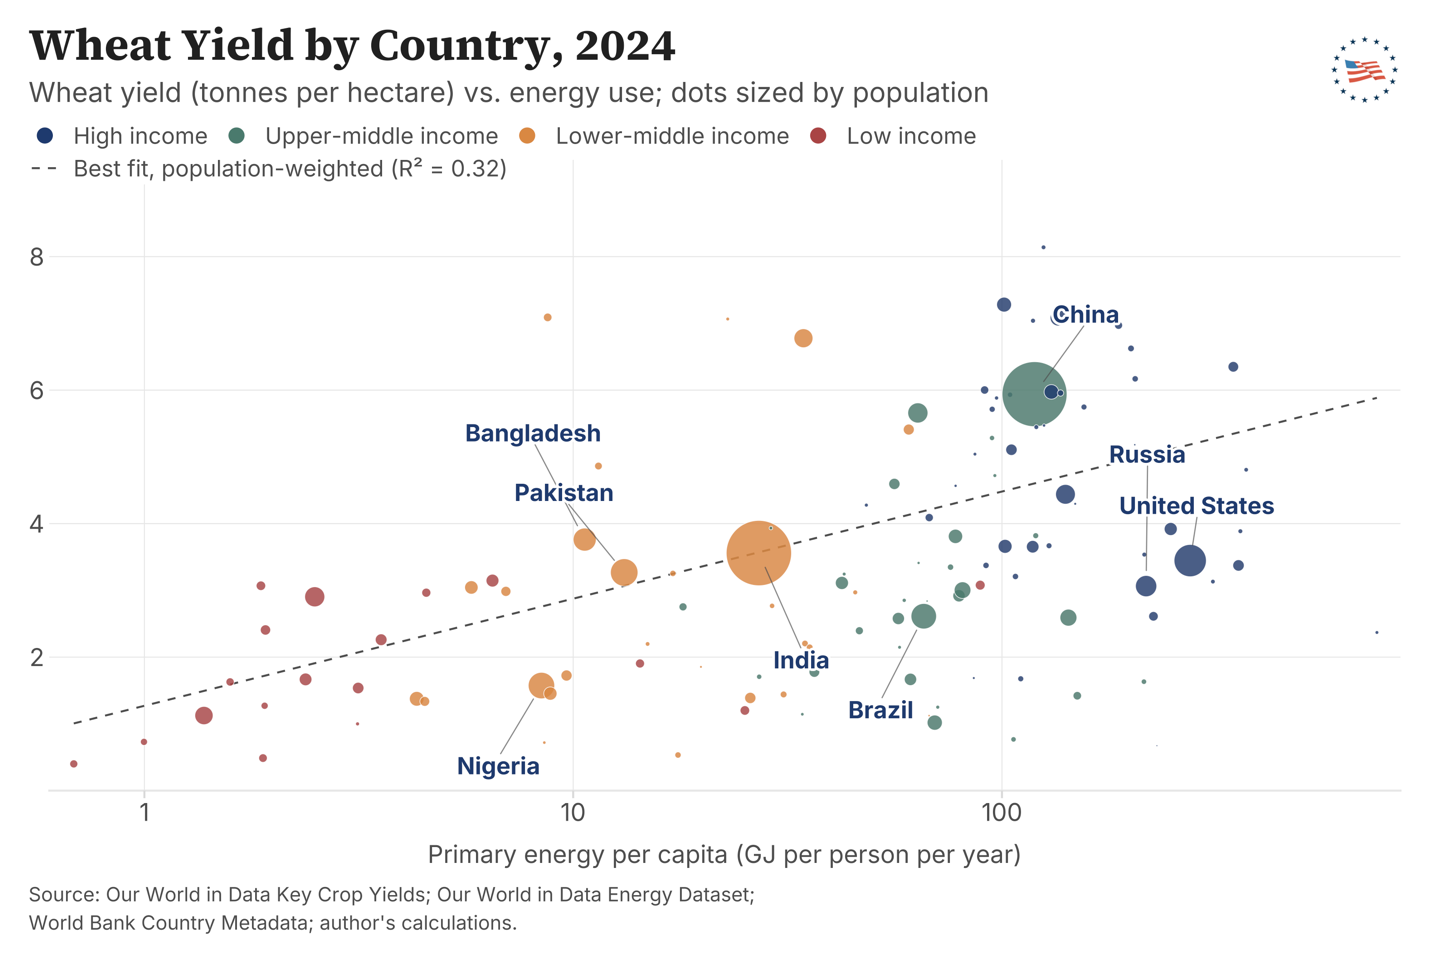
Figure 11a and 11c highlights trends in crop yields for corn and wheat from the early 1960s through 2024 at the global level and in the United States. Corn yields in the United States are consistently higher than the global average, and in 2024, the United States produced about 11 tonnes per hectare compared to just under 6 tonnes per hectare worldwide. Wheat yields have also increased over time, rising from approximately 1.6 to about 3.4 tonnes per hectare in the United States and from about 1.1 to 3.6 tonnes per hectare globally. The reasons for these gains are multiple and well-documented: improvements in seed genetics, the widespread adoption of synthetic nitrogen fertilizers (themselves highly energy-intensive to produce), expanded irrigation, and mechanization. Affordable and reliable energy is a necessary input to several of these advances—most directly through fertilizer production, irrigation pumping, and farm machinery—and supports the more recent adoption of GPS-based precision farming, remote sensing, and data-driven management tools (Erisman et al., 2008; Evenson & Gollin, 2003; FAO, 2021; NIFA, n.d.-a, n.d.-b; Smil, 2001).
Across each measure, a clear and consistent pattern emerges: countries with greater access to energy tend to exhibit higher incomes and greater levels of productivity. More broadly, access to affordable and reliable energy expands the capacity of individuals and firms to produce, earn, and improve their standard of living.
Energy and the Transformation of Global Health
Unlike the income and productivity relationships discussed earlier—where energy use and economic output are jointly determined—the relationship between energy access and public health operates through several direct mechanisms where the causal direction is clear. Modern healthcare delivery requires reliable electricity for surgical lighting, sterilization, refrigeration of vaccines and medications, diagnostic imaging, and life-support equipment such as incubators and ventilators. Clean water provision and wastewater treatment depend on energy for pumping, filtration, and chemical treatment. Cooking with clean fuels rather than biomass prevents the indoor air pollution that the World Health Organization estimates contributes to nearly three million deaths annually (World Health Organization, 2025). These are not statistical associations but rather physical requirements: where energy is unavailable or unreliable, the systems that sustain modern health outcomes cannot function. The cross-country and time-series evidence presented in this section is therefore best read as confirming what these mechanisms predict.
Figure 12a, for example, illustrates this progress through rising life expectancy in both the United States and worldwide. The aggregate trend reflects many overlapping advances—sanitation, vaccines, antibiotics, nutrition, and maternal care—most of which themselves depend on reliable energy infrastructure to deliver.
Figure 12a
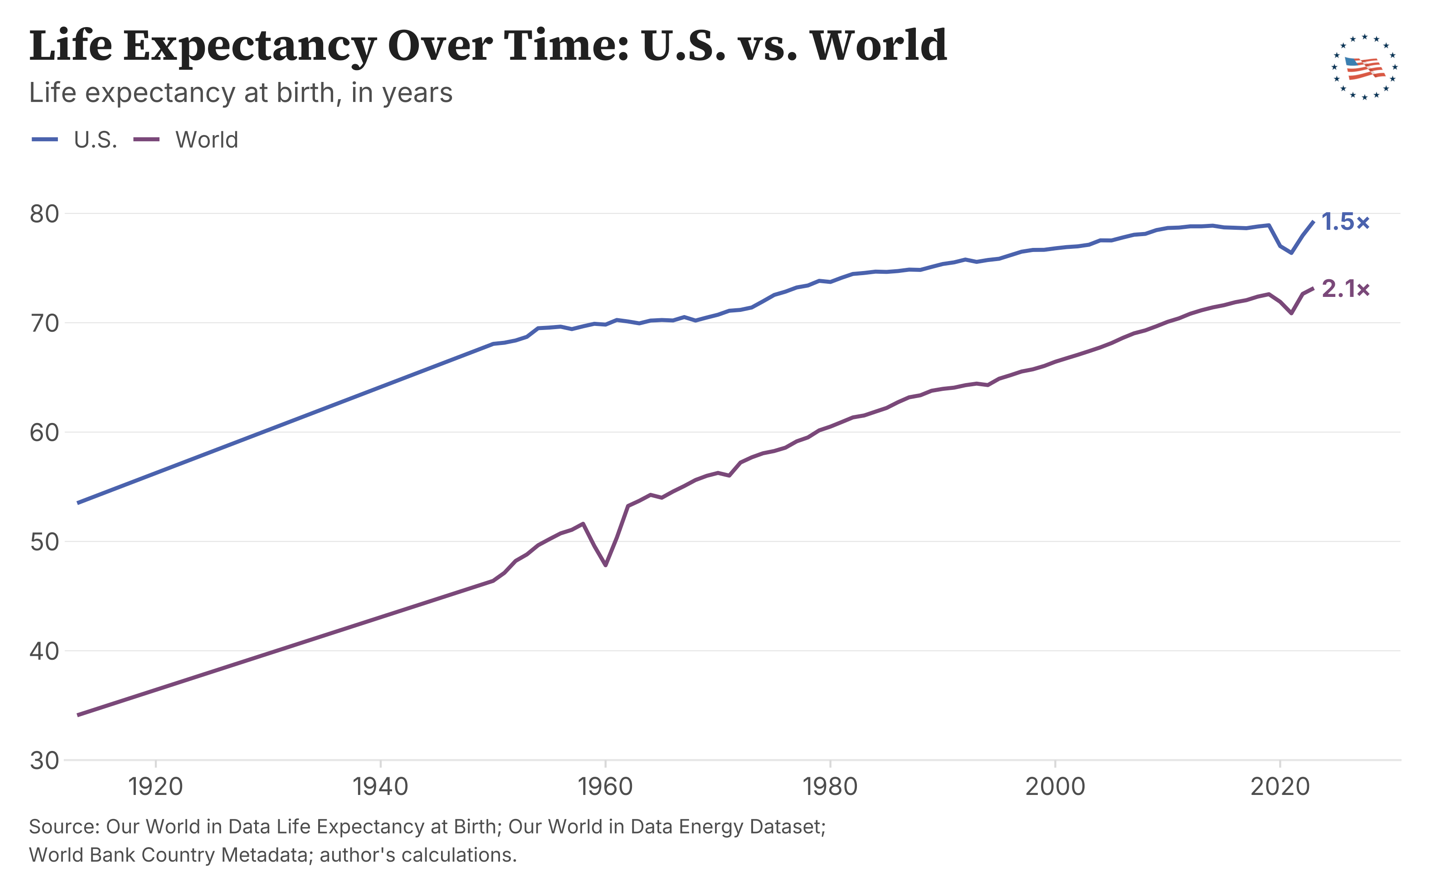
As shown in Figure 12a, global life expectancy was roughly 32 years in 1900, but over a century has more than doubled to over 73 years by 2023. The United States follows a similar pattern, where, despite a sharp decline during the 1918 influenza pandemic, life expectancy increased from about 49 years in the early 1900s to just under 80 years by 2023.
On a cross-sectional basis, Figure 12b shows the relationship between per capita energy consumption and life expectancy across countries in 2023. The relationship is strongly positive: countries with very low energy consumption tend to have substantially lower life expectancy than those with high consumption. Somalia and Chad, with low per capita energy use, have life expectancies below 60 years, while high-consumption countries such as Norway, Japan, and Switzerland exceed 80 years. This pattern should be interpreted carefully. At the aggregate level, energy consumption is correlated with the broader bundle of modernization—income, institutions, sanitation, and health systems—and the scatterplot does not isolate the marginal effect of energy alone.
Figure 12b
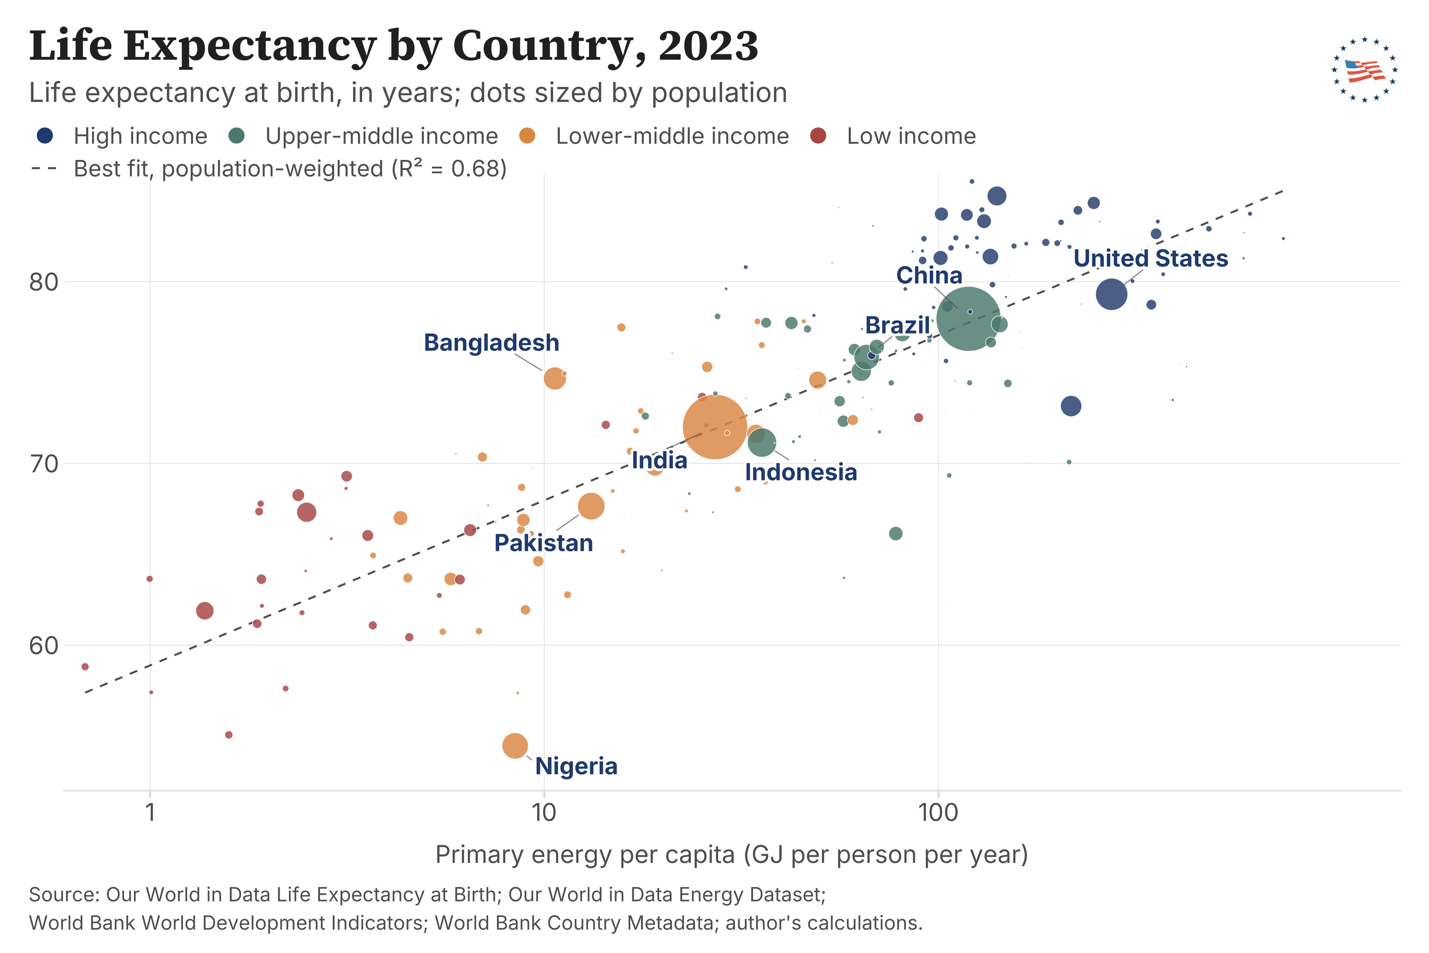
The cross-country data also reveal substantial variation in how efficiently a given level of energy use translates into health outcomes. Japan, Switzerland, and Hong Kong each achieve life expectancy above 83 years at roughly 120–130 GJ of primary energy per capita, well below U.S. consumption, while other countries at comparable energy levels perform less well. These differences reflect a range of factors largely unrelated to the quantity of energy consumed: settlement density and urban form, climate, the industrial composition of output, the share of consumption met by imported goods (whose production energy is counted abroad), and the efficiency of end-use technologies and building stock. The implication is that energy is a necessary input to modern health outcomes—no country has achieved high life expectancy without substantial energy use—but the relationship between energy and welfare is mediated by how energy systems are configured, not by energy quantity alone.
Figure 13a offers a visual representation of the changes in child mortality since the mid-twentieth century both globally as well as in the United States:
Figure 13a
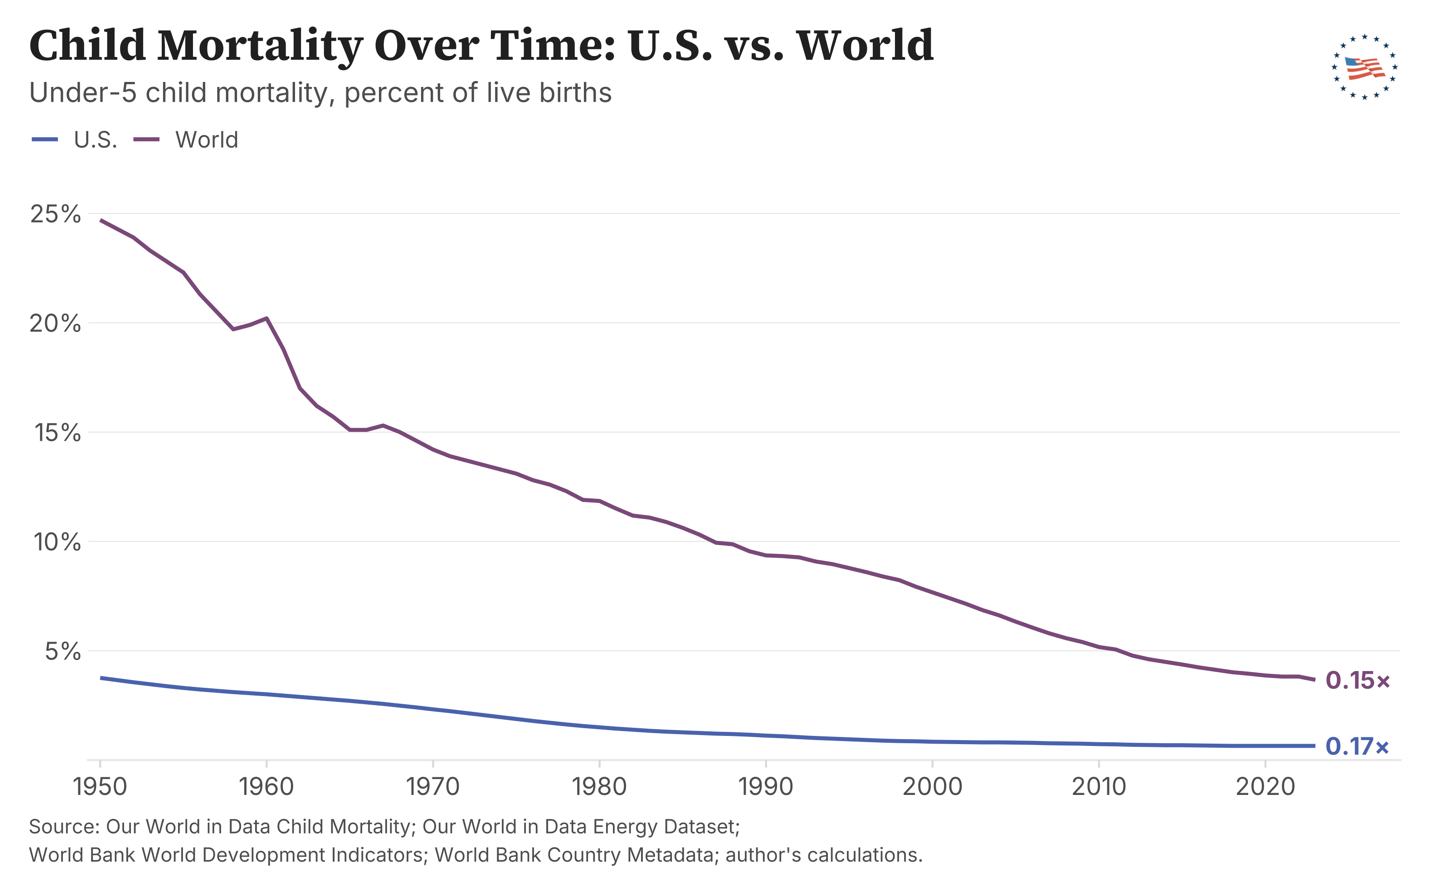
Figure 13b
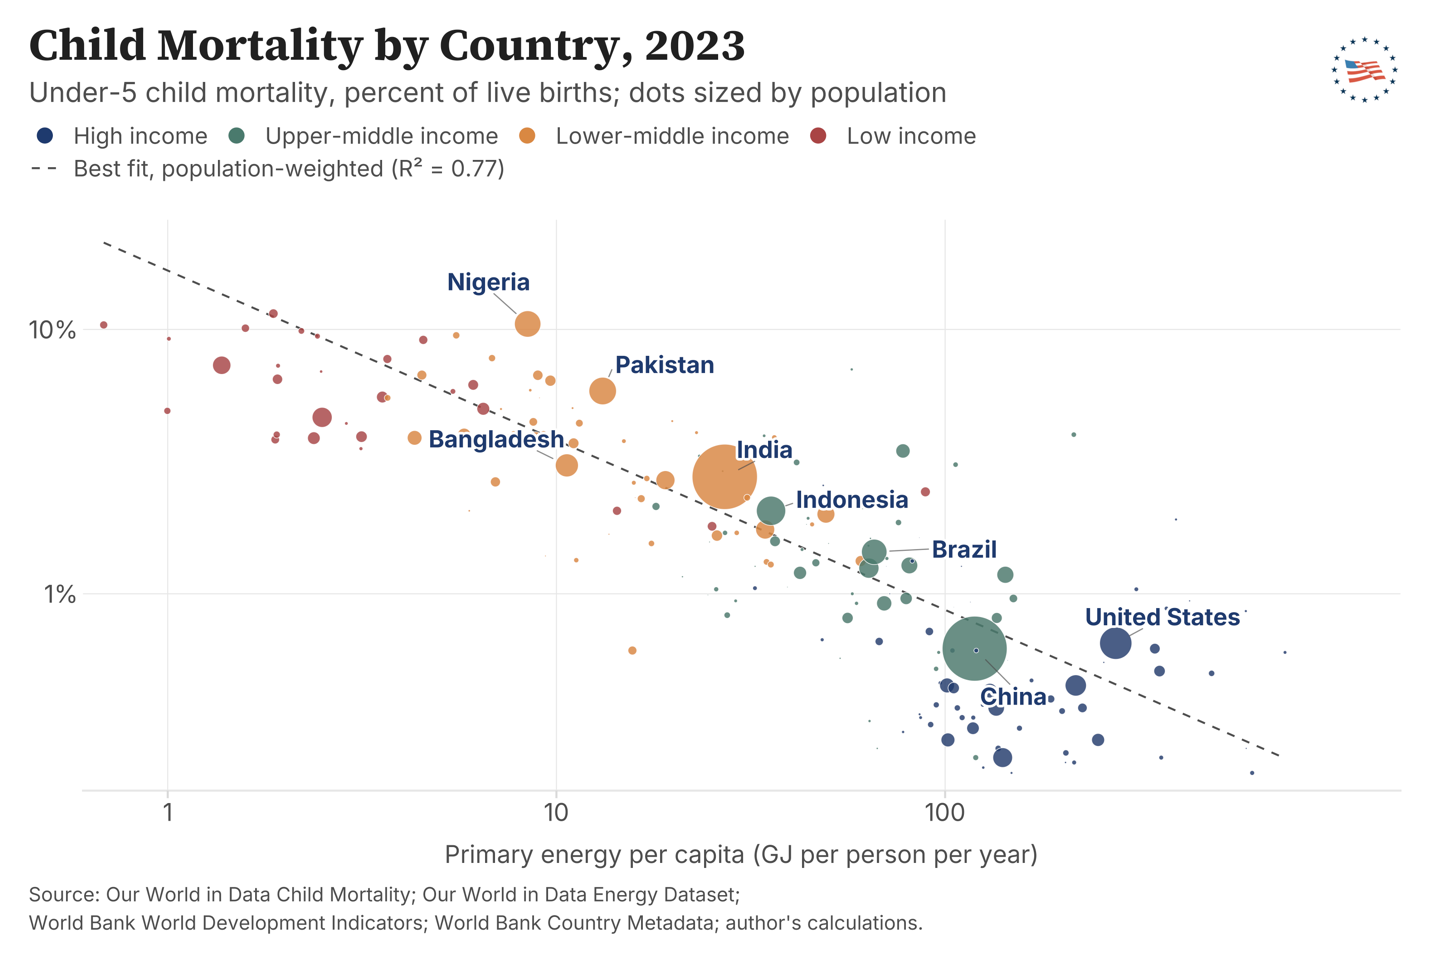
As Figure 13a shows, child mortality rates fell globally from nearly 25 percent in 1950 to about 3.7 percent in 2023. In the United States, these percentages also plummeted—from 3.8 percent in 1950 to less than one percent by 2023. As shown in Figure 14b, on a cross-country basis it is clear that there is a strong negative relationship, where countries with low energy consumption tend to have much higher rates of child mortality compared to countries with higher energy consumption that have significantly lower child mortality. For example, countries such as Somalia and Chad that have low energy consumption have child mortality rates exceeding 10 percent, whereas countries such as Norway, Japan, and Switzerland that have much higher energy consumption have child mortality rates below 1 percent.
The reasons for these gains are straightforward. Access to affordable and reliable energy powers the hospitals where doctors are trained and practice, enables pharmaceutical companies to develop life-saving medications, and underpins many of the technologies that save lives.
This aspect of health care is only part of the story, however. Energy access also determines whether populations have clean air to breathe and clean water to drink — two of the most fundamental determinants of public health. Clean air and clean water are fundamentally important to healthy lives, and energy access shapes both. Greater access to energy expands the range of available sources, enabling countries to shift toward cleaner options. In many developing nations, however, households still rely on biomass fuels—such as wood, charcoal, and crop residues—for cooking and heating, contributing significantly to indoor and outdoor air pollution (Amegah & Jaakkola, 2016; World Health Organization, 2025).
Reliable energy is also important for securing clean water. In fact, meeting energy needs requires water, and energy is needed for pumping, treatment, and distribution of water, as well as for collection, treatment, and discharge of wastewater—a relationship known as the energy-water nexus (Copeland & Carter, 2017; The Berkey, n.d.). By some estimates, 80 percent of the cost of water provision is related to energy, making modern water systems fundamentally dependent on a consistent supply.
Expanded energy access also accelerates the development and adoption of cleaner production technologies, including pollution-control tools such as scrubbers and electrostatic precipitators that can remove over 99 percent of particulates from emissions (U.S. Environmental Protection Agency, 2025). In this way, energy access not only supports economic development but plays a central role in improving environmental quality and human health.
Figures 14a, 14b, 14c and 14d depict the relationship between per capita energy consumption and deaths attributable to dirty air and water on a cross-country basis.
Figure 14a

Figure 14b
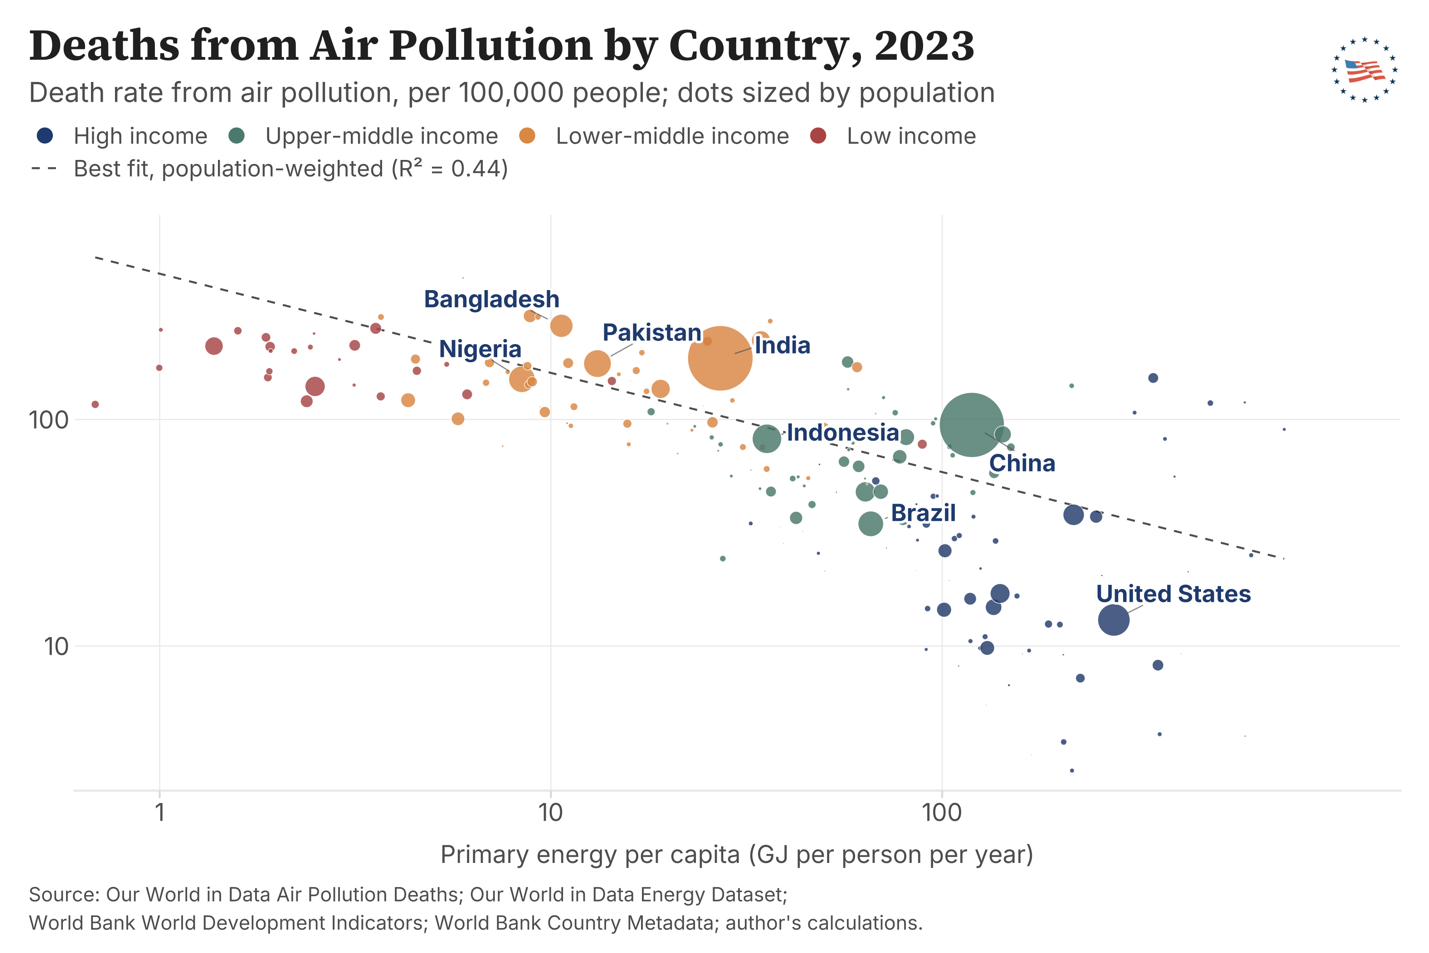
Figure 14c
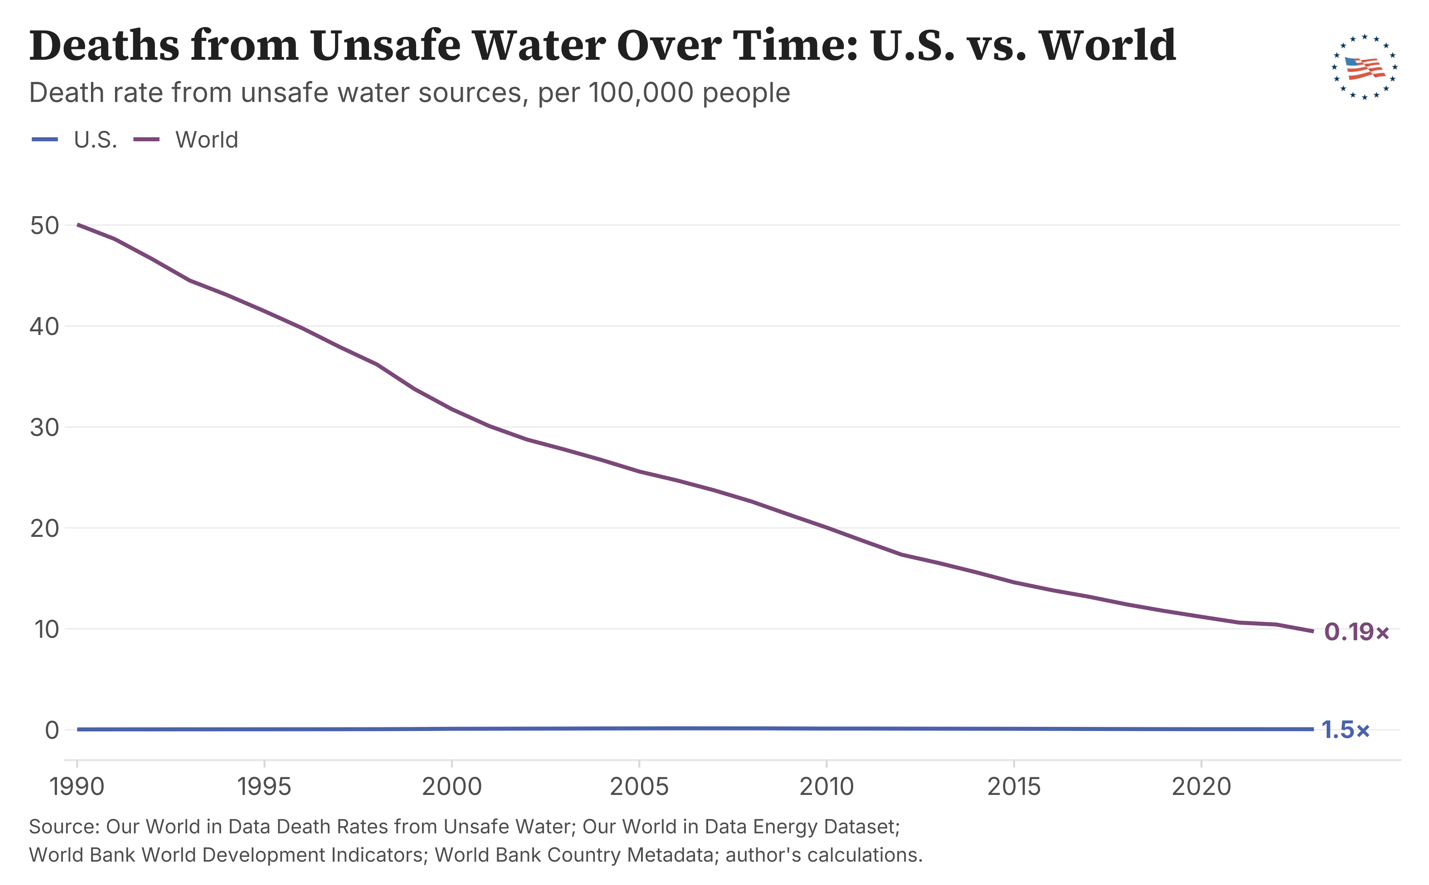
Figure 14d

As the time-series panel in Figure 14a shows, there has been a dramatic decline in air-pollution deaths: mortality fell more than four-fold since 1990 (from about 57 to 13 per 100,000) domestically and roughly halved (from 180 to 92) globally. In terms of unsafe drinking water, global deaths fell from 50 to under 10 per 100,000—an 80 percent decline driven largely by middle-income economies gaining reliable water and energy infrastructure. The lone counter-trend is a small uptick in U.S. unsafe-water deaths from a near-zero base (about 0.04 to 0.06 per 100,000), most likely reflecting the documented rise of Legionnaires' disease in aging premise plumbing combined with an older, more vulnerable population (Barskey et al., 2022; Moffa et al., 2023). Notably, the remedies for this uptick—water-system upgrades, building plumbing replacement, and modern hospital capacity—are themselves energy-intensive, so addressing this trend will require sustained infrastructure investment that depends in part on the reliable energy systems supporting modern water treatment.
Figure 14b and 14d also show the relationship between per capita energy consumption and deaths due to air pollution and unsafe drinking water across countries in 2023, demonstrating that mortality rates tend to decline as energy consumption increases. Countries with very low energy use (less than 600 kWh per person), such as Somalia and Madagascar, have some of the highest mortality rates, with air-pollution death rates of roughly 100-200 deaths per 100,000 people and unsafe-drinking-water death rates reaching tens to over 100 per 100,000. In contrast, countries with much higher energy consumption, including Finland, Sweden, and Iceland, have far lower mortality rates, with deaths from unsafe drinking water close to zero and air-pollution death rates only a few per 100,000.
As the data shows, higher energy consumption correlates strongly with lower mortality from air pollution and unsafe water. Where energy is scarce, preventable deaths remain stubbornly high; where it is plentiful, they fall to near zero. Clean air and clean water are products of infrastructure, and that infrastructure depends on reliable power—making expanded energy access not a secondary benefit of economic development, but a core public health imperative.
Taken together, the evidence points to a clear conclusion regarding the link between access to affordable and reliable energy and health outcomes; namely, improvements in public health are closely tied to access to affordable and reliable energy. From extending life expectancy and reducing child mortality to enabling clean water systems and lowering exposure to harmful pollution, energy underpins many of the basic conditions required for a healthy society. These gains are not incidental—they reflect the role of energy in powering the infrastructure, technologies, and institutions that sustain modern health systems. For policymakers, the implication is straightforward: expanding access to energy is not only an economic priority, but a public health imperative.
Policy Implications
The statistical analysis presented in this paper establishes two key findings of differing strength:
In advanced economies, additional energy use yields smaller gains; however, this phenomenon has historically reflected saturation and increases in efficiency, not diminished importance. Services, information, and the built environment all run continuously on energy, and the floor required to sustain a modern economy is high and non-negotiable. Modest marginal returns measure how thoroughly energy already underpins these economies, not evidence that it has become optional.
Regardless, energy abundance will continue to remain essential across both stages of development, though for different reasons. In developing economies, expanded access is the precondition for the industrialization, infrastructure buildout, and public health gains documented above—the path every advanced economy has already traveled. In developed economies, the demands of the coming decades will be shaped by the rapid growth of AI infrastructure, electrification of the transportation industry, and advanced manufacturing, all of which require substantial new generation and grid capacity.
As a result, we have the following policy recommendations:
A Bipartisan Commission to Investigate Permitting Reform
Data centers in particular are projected to drive a significant share of new electricity demand in the United States and other advanced economies through the next decade—the IEA forecasts U.S. electricity demand growth of roughly 2 percent per year through 2030, with about half of that increase coming from data center expansion alone—reversing the long period of flat or declining consumption that defined the post-2008 era. Whether the question is bringing a developing country online or powering the next generation of computing, the answer requires more energy, not less (International Energy Agency, 2026).
A critical component of this effort is the regulatory environment governing energy development. Lengthy permitting processes, overlapping federal and state requirements, and uncertainty in project approval can delay or prevent the deployment of energy infrastructure. These barriers can constrain supply, increase costs, and limit the ability of economies to respond to growing energy demand. Streamlining permitting, improving regulatory coordination, and reducing unnecessary delays could meaningfully expand energy availability while maintaining appropriate safeguards.
More concretely, given the magnitude and urgency of the coming energy buildout, Congress should consider establishing a bipartisan permitting reform commission similar to the National Commission on Fiscal Responsibility and Reform (Bowles-Simpson) (Capretta & Rowing, 2023; West & Gabriele, 2012). Different energy sources operate under different permitting regimes—nuclear projects operate under the Nuclear Regulatory Commission, interstate transmission operates under the Federal Energy Regulatory Commission, oil and gas leasing under the Bureau of Land Management, and large-scale renewable projects typically through a mix of state and federal authorities—and each raises distinct, legitimate questions about environmental review, community input, and federal preemption. A commission overarchingly examining these regimes could identify common bottlenecks across them and propose reforms that preserve meaningful safeguards while reducing the years of unnecessary delay that now routinely accompany major energy projects. Whatever the specifics such a body might recommend, the question itself is imperative: the data center buildout already under way will require energy infrastructure on a scale that the current permitting regime is structurally unprepared to deliver on a relevant timeline. A near-term commitment to institutional reform is therefore as consequential as any individual policy choice on its merits.
Adopt an All of The Above Approach for Energy Policy
An “all-of-the-above” approach to energy development can help ensure affordability, reliability, and resilience. Different energy sources offer distinct advantages, and a diversified energy portfolio reduces vulnerability to supply disruptions while supporting scalable growth. Encouraging innovation across a wide range of energy technologies—including fossil fuels, nuclear power, and renewable sources—can expand supply and improve efficiency over time.
The Trump administration's Executive Order 14154, "Unleashing American Energy," is a step in the right direction, removing several regulatory barriers to domestic energy development and pausing the disbursement of Inflation Reduction Act funds inconsistent with that aim. Executive actions such as EO 14154, however, can reach only the grant and loan disbursements under executive control; the IRA's energy-related tax credits continue to sit outside that reach and remain in force until Congress acts. Yet the One Big Beautiful Bill Act of 2025 (OBBB) leaves a number of energy-related subsidies in place, and in some cases expands them. The Clean Fuel Production credit, for example, was extended through the end of 2029 and modified to make the credit more readily available to land-intensive biofuels such as corn ethanol and soy biodiesel, at an estimated cost of roughly $25 billion in additional federal deficits over the 2025–2034 window. The carbon oxide sequestration credit was likewise expanded, broadening the $85-per-ton ($180-per-ton for direct air capture) subsidy to a wider set of qualifying uses, adding approximately $14 billion to the deficit over the same period. Such credits distort investment decisions in transportation fuel and electricity markets, and they create constituencies for their own extension that make eventual repeal politically harder the longer they remain in place. A consistent "all-of-the-above" approach—one that lets energy sources compete on their economic and operational merits rather than on the basis of preferential tax treatment—would call for repealing the energy-related subsidies that OBBB retains (Gae, 2026a; Gae, 2026b).
More fundamentally, policymakers should carefully weigh the tradeoffs associated with policies that restrict energy supply or significantly increase its cost. While such policies may be pursued for environmental or other objectives, they can also impose costs on productivity, income growth, and access to essential services that should be weighed alongside their intended benefits. These effects are likely most pronounced in energy-constrained regions and developing economies, where access to energy remains closely tied to basic improvements in quality of life. Critics have cited climate change as a reason to constrict certain forms of energy. The empirical case for unilateral restriction in advanced economies is weaker than often assumed: modeling done by Advancing American Freedom suggests that even complete decarbonization of the United States and the European Union would reduce projected end-of-century warming by no more than 0.24°C and 0.14°C respectively, indicating that emissions reductions confined to advanced economies—irrespective of assumptions made—will not meaningfully impact global temperatures (Dayaratna, 2025; Dayaratna, 2026; Dayaratna & Loris, 2019).
Finally, expanding global energy access should remain a core development priority. Large portions of the world’s population still lack reliable electricity and modern energy services. Improving access in these regions is likely to yield substantial gains in income, health, and overall well-being, reinforcing the central finding of this paper: energy availability is a key driver of human advancement.
Conclusion
The evidence presented in this paper points to a consistent conclusion: access to affordable and reliable energy is a foundational input to modern economic performance and human well-being. In developing economies, expanded energy access remains tightly coupled to gains in income, productivity, agricultural output, and public health — the same path every advanced economy has already traveled. In advanced economies, the floor of consumption required to sustain a modern services-and-information economy is already high and non-negotiable, and the next decade will mark a decisive break from the post-2008 era of flat or declining demand. AI infrastructure, advanced manufacturing, and the electrification of transportation and heating are driving a return to sustained growth in energy use, requiring substantial new generation and grid capacity on a scale that has yet to be seen.
Energy and prosperity are best understood as mutually reinforcing rather than as one variable causing the other. Energy access enables production and raises incomes; rising incomes finance further energy infrastructure and support more energy-intensive consumption. The two co-evolve, which is why no country has achieved high incomes, long life expectancy, or low child mortality without substantial energy use, and why restrictions on energy availability risk disrupting the self-reinforcing dynamic through which countries sustain and improve living standards.
For policymakers, this implies different priorities at different stages. Expanding energy access in regions where it remains scarce is among the highest-return development interventions available—the welfare gains are large, the mechanisms are clear, and the cross-country evidence is consistent. In advanced economies, ensuring that energy supply can meet rising demand from AI, advanced manufacturing, and other goals is a forward-looking imperative, and policies that constrain supply or significantly raise its cost should be weighed against the aggregate costs of doing so.
Sustaining modern living standards requires abundant, affordable, and reliable energy. Developing economies need energy to grow, and advanced economies need energy to remain strong. Policymakers should act accordingly.
References
Amegah, A. K., & Jaakkola, J. J. K. (2016). Household air pollution and the sustainable development goals. Bulletin of the World Health Organization, 94(3), 215–221. https://pmc.ncbi.nlm.nih.gov/articles/PMC4773927/
Barskey, A. E., Derado, G., & Edens, C. (2022). Rising incidence of Legionnaires' disease and associated epidemiologic patterns, United States, 1992–2018. Emerging Infectious Diseases, 28(3), 527–538. https://doi.org/10.3201/eid2803.211435
Capretta, J. C., & Rowing, J. (2023, November 29). A look back at Simpson-Bowles. AEIdeas. https://www.aei.org/economics/a-look-back-at-simpson-bowles/
Congressional Research Service. (2025, May 27). Excess military infrastructure and the Base Realignment and Closure (BRAC) process [CRS Report No. R48547]. https://www.congress.gov/crs-product/R48547
Copeland, C., & Carter, N. T. (2017). Energy-water nexus: The water sector's energy use [CRS Report No. R43200]. Congressional Research Service. https://www.everycrsreport.com/reports/R43200.html
Dayaratna, K. D. (2025, April 2). Statement of Kevin D. Dayaratna, Ph.D., before the Subcommittee on Oversight and Investigations, Committee on Natural Resources, U.S. House of Representatives, on "Unleashing the golden age of American energy dominance." 119th Cong., 1st sess. https://www.congress.gov/119/meeting/house/118088/witnesses/HHRG-119-II15-Wstate-DayaratnaK-20250402.pdf
Dayaratna, K. D. (2026, January 16). If the UN climate treaty disappeared, would the climate notice? Newsweek. https://www.newsweek.com/if-the-un-climate-treaty-disappeared-would-the-climate-notice-opinion-11374337
Dayaratna, K. D., & Loris, N. D. (2019, July 24). Assessing the costs and benefits of the Green New Deal's energy policies [Backgrounder No. 3427]. Heritage Foundation. https://www.heritage.org/energy-economics/report/assessing-the-costs-and-benefits-the-green-new-deals-energy-policies
Dayaratna, K. D., et al. (2023). Powering human advancement: Why the world needs affordable and reliable energy. Heritage Foundation. https://www.heritage.org/energy/report/powering-human-advancement-why-the-world-needs-affordable-and-reliable-energy
Erisman, J. W., et al. (2008). How a century of ammonia synthesis changed the world. Nature Geoscience, 1, 636–639. https://doi.org/10.1038/ngeo325
Evenson, R. E., & Gollin, D. (2003). Assessing the impact of the Green Revolution, 1960 to 2000. Science, 300(5620), 758–762. https://doi.org/10.1126/science.1078710
Food and Agriculture Organization. (2021). The state of the world's land and water resources for food and agriculture: Systems at breaking point. https://www.fao.org/land-water/solaw2021/en/
Gae, A. (2026a, April 11). Carbon oxide sequestration subsidy. Advancing American Freedom. https://advancingamericanfreedom.com/carbon-oxide-sequestration-subsidy/
Gae, A. (2026b, April 11). Expansion of clean fuel production subsidy. Advancing American Freedom. https://advancingamericanfreedom.com/expansion-of-clean-fuel-production-subsidy/
International Energy Agency. (2026). Electricity 2026. https://www.iea.org/reports/electricity-2026
Kraft, J., & Kraft, A. (1978). On the relationship between energy and GNP. Journal of Energy and Development, 3(2), 401–403. https://www.jstor.org/stable/24806805
Moffa, M. A., et al. (2023). Legionellosis on the rise: A scoping review of sporadic, community-acquired incidence in the United States. Epidemiology & Infection, 151, e133. https://doi.org/10.1017/S0950268823001206
National Institute of Food and Agriculture. (n.d.-a). Agriculture technology. Retrieved May 21, 2026, from https://www.nifa.usda.gov/topics/agriculture-technology
National Institute of Food and Agriculture. (n.d.-b). Artificial intelligence. Retrieved May 21, 2026, from https://www.nifa.usda.gov/grants/programs/data-science-food-agricultural-systems-dsfas/artificial-intelligence
Ozturk, I. (2010). A literature survey on energy-growth nexus. Energy Policy, 38(1), 340–349. https://doi.org/10.1016/j.enpol.2009.09.024
Smil, V. (2001). Enriching the earth: Fritz Haber, Carl Bosch, and the transformation of world food production. MIT Press.
Smil, V. (2017). Energy and civilization: A history. MIT Press.
The Berkey. (n.d.). What is the water-energy nexus? The definition and concept explained. Retrieved May 21, 2026, from https://theberkey.com/blogs/water-filter/what-is-the-water-energy-nexus-the-definition-and-concept-explained
U.S. Environmental Protection Agency. (2025, June 9). Monitoring by control technique—Electrostatic precipitators. https://www.epa.gov/air-emissions-monitoring-knowledge-base/monitoring-control-technique-electrostatic-precipitators
West, D. M., & Gabriele, A. (2012, November). Ten leadership lessons from Simpson-Bowles. Brookings Institution. https://www.brookings.edu/articles/ten-leadership-lessons-from-simpson-bowles/
World Bank. (n.d.). The World Bank Atlas method – Detailed methodology. World Bank Data Help Desk. Retrieved May 21, 2026, from https://datahelpdesk.worldbank.org/knowledgebase/articles/378832-the-world-bank-atlas-method-detailed-methodology
World Health Organization. (2025, December 16). Household air pollution. https://www.who.int/news-room/fact-sheets/detail/household-air-pollution-and-health
Appendix: Sources for Figures
Figure 1:
Our World in Data. (2026). Share of United States households using specific technologies [Dataset]. Retrieved May 12, 2026, from https://archive.ourworldindata.org/20260511-092124/grapher/technology-adoption-by-households-in-the-united-states.html
U.S. Census Bureau. (2023a). American Housing Survey (AHS): 2023 national public use file (PUF). https://www.census.gov/programs-surveys/ahs/data/2023/ahs-2023-public-use-file-puf-/ahs-2023-national-public-use-file-puf-.html
U.S. Census Bureau. (2023b). Selected housing characteristics (DP04). American Community Survey (ACS). https://data.census.gov/table/ACSDP1Y2023.DP04
U.S. Census Bureau. (2023c). Types of computers and internet subscriptions (S2801). American Community Survey (ACS). https://data.census.gov/table/ACSST1Y2023.S2801
U.S. Energy Information Administration. (2020). Residential Energy Consumption Survey (RECS). https://www.eia.gov/consumption/residential/data/2020/
Figure 2:
U.S. Energy Information Administration. (n.d.). Total energy [Dataset]. https://www.eia.gov/totalenergy/
U.S. Energy Information Administration. (n.d.). Monthly Energy Review, Appendix E, Table E1 [Archived dataset, p. 341]. https://www.eia.gov/totalenergy/data/annual/archive/038411.pdf
U.S. Energy Information Administration. (n.d.). Total energy: Primary energy overview (Table T01.01) [Dataset]. https://www.eia.gov/totalenergy/data/browser/xls.php?tbl=T01.01&freq=m
Our World in Data. (n.d.). Global primary energy consumption [Dataset]. https://ourworldindata.org/grapher/global-primary-energy
Energy Institute. (n.d.). Statistical review of world energy. https://www.energyinst.org/statistical-review
Smil, V. (2017). Energy transitions: Global and national perspectives (2nd, expanded and updated ed.). Praeger. https://vaclavsmil.com/book/energy-transitions-global-and-national-perspectives-second-expanded-and-updated-edition/
Figure 3:
Bolt, J., & van Zanden, J. L. (2023). Maddison Project Database 2023: Gross domestic product (GDP) — long-run data in constant international dollars [Dataset]. With major processing by Our World in Data. Archived April 10, 2026. https://archive.ourworldindata.org/20260410-215714/grapher/gdp-maddison-project-database.html
World Bank. (n.d.). GDP (constant 2015 US$) — United States [Dataset]. World Development Indicators. https://data.worldbank.org/indicator/NY.GDP.MKTP.KD?locations=US
World Bank. (n.d.). GDP (constant 2015 US$) — World [Dataset]. World Development Indicators. https://data.worldbank.org/indicator/NY.GDP.MKTP.KD?locations=1W
Figure 4 (a) and (b):
U.S. Energy Information Administration. (n.d.). Total energy [Dataset]. https://www.eia.gov/totalenergy/
U.S. Energy Information Administration. (n.d.). Monthly Energy Review, Appendix E, Table E1 [Archived dataset, p. 341]. https://www.eia.gov/totalenergy/data/annual/archive/038411.pdf
U.S. Energy Information Administration. (n.d.). Total energy: Primary energy overview (Table T01.01) [Dataset]. https://www.eia.gov/totalenergy/data/browser/xls.php?tbl=T01.01&freq=m
Our World in Data. (n.d.). Global primary energy consumption [Dataset]. https://ourworldindata.org/grapher/global-primary-energy
Energy Institute. (n.d.). Statistical review of world energy. https://www.energyinst.org/statistical-review
Smil, V. (2017). Energy transitions: Global and national perspectives (2nd, expanded and updated ed.). Praeger. https://vaclavsmil.com/book/energy-transitions-global-and-national-perspectives-second-expanded-and-updated-edition/
Bolt, J., & van Zanden, J. L. (2023). Maddison Project Database 2023: Gross domestic product (GDP) — long-run data in constant international dollars [Dataset]. With major processing by Our World in Data. Archived April 10, 2026. https://archive.ourworldindata.org/20260410-215714/grapher/gdp-maddison-project-database.html
World Bank. (n.d.). GDP (constant 2015 US$) — United States [Dataset]. World Development Indicators. https://data.worldbank.org/indicator/NY.GDP.MKTP.KD?locations=US
World Bank. (n.d.). GDP (constant 2015 US$) — World [Dataset]. World Development Indicators. https://data.worldbank.org/indicator/NY.GDP.MKTP.KD?locations=1W
Figure 5 (a) and (b):
U.S. Energy Information Administration. (n.d.). Total energy [Dataset]. https://www.eia.gov/totalenergy/
U.S. Energy Information Administration. (n.d.). Monthly Energy Review, Appendix E, Table E1 [Archived dataset, p. 341]. https://www.eia.gov/totalenergy/data/annual/archive/038411.pdf
U.S. Energy Information Administration. (n.d.). Total energy: Primary energy overview (Table T01.01) [Dataset]. https://www.eia.gov/totalenergy/data/browser/xls.php?tbl=T01.01&freq=m
Bolt, J., & van Zanden, J. L. (2023). Maddison Project Database 2023: Gross domestic product (GDP) — long-run data in constant international dollars [Dataset]. With major processing by Our World in Data. Archived April 10, 2026. https://archive.ourworldindata.org/20260410-215714/grapher/gdp-maddison-project-database.html
U.S. Bureau of Economic Analysis. (n.d.). National income and product accounts, Section 1: Domestic product and income [Dataset]. https://apps.bea.gov/national/Release/XLS/Survey/Section1All_xls.xlsx
Figure 6 (a) and (b):
Our World in Data. (n.d.). Energy dataset [Dataset]. https://github.com/owid/energy-data
World Bank. (n.d.). World development indicators [Dataset]. https://databank.worldbank.org/source/world-development-indicators
Figure 7 (a) and (b):
Our World in Data. (n.d.). Energy dataset [Dataset]. https://github.com/owid/energy-data
World Bank. (n.d.). World development indicators [Dataset]. https://databank.worldbank.org/source/world-development-indicators
World Bank. (n.d.). Country metadata API [Dataset]. https://api.worldbank.org/v2/country?format=json&per_page=400
Figure 8 (a):
Our World in Data. (n.d.). Energy dataset [Dataset]. https://github.com/owid/energy-data
Our World in Data. (n.d.). GDP per capita (Maddison Project Database) [Dataset]. https://ourworldindata.org/grapher/gdp-per-capita-maddison-project-database
World Bank. (n.d.). Country metadata API [Dataset]. https://api.worldbank.org/v2/country?format=json&per_page=400
Figure 8 (b):
Our World in Data. (n.d.). Energy dataset [Dataset]. https://github.com/owid/energy-data
Our World in Data. (n.d.). GDP per capita (Maddison Project Database) [Dataset]. https://ourworldindata.org/grapher/gdp-per-capita-maddison-project-database
World Bank. (n.d.). Country metadata API [Dataset]. https://api.worldbank.org/v2/country?format=json&per_page=400
Figure 9 (a):
Our World in Data. (n.d.). Energy dataset [Dataset]. https://github.com/owid/energy-data
Our World in Data. (n.d.). Labor productivity per hour (Penn World Table) [Dataset]. https://ourworldindata.org/grapher/labor-productivity-per-hour-pennworldtable
World Bank. (n.d.). Country metadata API [Dataset]. https://api.worldbank.org/v2/country?format=json&per_page=400
Figure 9 (b):
Our World in Data. (n.d.). Energy dataset [Dataset]. https://github.com/owid/energy-data
Our World in Data. (n.d.). Labor productivity per hour (Penn World Table) [Dataset]. https://ourworldindata.org/grapher/labor-productivity-per-hour-pennworldtable
World Bank. (n.d.). Country metadata API [Dataset]. https://api.worldbank.org/v2/country?format=json&per_page=400
Figure 10 (a):
Our World in Data. (n.d.). Energy dataset [Dataset]. https://github.com/owid/energy-data
United Nations Statistics Division. (n.d.). National accounts main aggregates database (SNAMA) [Dataset]. https://unstats.un.org/unsd/snaama/
World Bank. (n.d.). World development indicators [Dataset]. https://databank.worldbank.org/source/world-development-indicators
World Bank. (n.d.). Country metadata API [Dataset]. https://api.worldbank.org/v2/country?format=json&per_page=400
Open Knowledge Foundation. (n.d.). Country codes: M49 to ISO 3166-1 alpha-3 mapping [Dataset]. GitHub. https://github.com/datasets/country-codes
Figure 10 (b):
Our World in Data. (n.d.). Energy dataset [Dataset]. https://github.com/owid/energy-data
United Nations Statistics Division. (n.d.). National accounts main aggregates database (SNAMA) [Dataset]. https://unstats.un.org/unsd/snaama/
World Bank. (n.d.). World development indicators [Dataset]. https://databank.worldbank.org/source/world-development-indicators
World Bank. (n.d.). Country metadata API [Dataset]. https://api.worldbank.org/v2/country?format=json&per_page=400
Open Knowledge Foundation. (n.d.). Country codes: M49 to ISO 3166-1 alpha-3 mapping [Dataset]. GitHub. https://github.com/datasets/country-codes
Figure 11 (a):
Our World in Data. (n.d.). Energy dataset [Dataset]. https://github.com/owid/energy-data
Our World in Data. (n.d.). Key crop yields [Dataset]. https://ourworldindata.org/grapher/key-crop-yields
World Bank. (n.d.). Country metadata API [Dataset]. https://api.worldbank.org/v2/country?format=json&per_page=400
Figure 11 (b):
Our World in Data. (n.d.). Energy dataset [Dataset]. https://github.com/owid/energy-data
Our World in Data. (n.d.). Key crop yields [Dataset]. https://ourworldindata.org/grapher/key-crop-yields
World Bank. (n.d.). Country metadata API [Dataset]. https://api.worldbank.org/v2/country?format=json&per_page=400
Figure 11 (c):
Our World in Data. (n.d.). Energy dataset [Dataset]. https://github.com/owid/energy-data
Our World in Data. (n.d.). Key crop yields [Dataset]. https://ourworldindata.org/grapher/key-crop-yields
World Bank. (n.d.). Country metadata API [Dataset]. https://api.worldbank.org/v2/country?format=json&per_page=400
Figure 11 (d):
Our World in Data. (n.d.). Energy dataset [Dataset]. https://github.com/owid/energy-data
Our World in Data. (n.d.). Key crop yields [Dataset]. https://ourworldindata.org/grapher/key-crop-yields
World Bank. (n.d.). Country metadata API [Dataset]. https://api.worldbank.org/v2/country?format=json&per_page=400
Figure 12 (a):
Our World in Data. (n.d.). Energy dataset [Dataset]. https://github.com/owid/energy-data
Our World in Data. (n.d.). Life expectancy at birth [Dataset]. https://ourworldindata.org/grapher/life-expectancy
World Bank. (n.d.). World development indicators [Dataset]. https://databank.worldbank.org/source/world-development-indicators
World Bank. (n.d.). Country metadata API [Dataset]. https://api.worldbank.org/v2/country?format=json&per_page=400
Figure 12 (b):
Our World in Data. (n.d.). Energy dataset [Dataset]. https://github.com/owid/energy-data
Our World in Data. (n.d.). Life expectancy at birth [Dataset]. https://ourworldindata.org/grapher/life-expectancy
World Bank. (n.d.). Country metadata API [Dataset]. https://api.worldbank.org/v2/country?format=json&per_page=400
Figure 13 (a):
Our World in Data. (n.d.). Energy dataset [Dataset]. https://github.com/owid/energy-data
Our World in Data. (n.d.). Child mortality rate [Dataset]. https://ourworldindata.org/grapher/child-mortality
World Bank. (n.d.). Country metadata API [Dataset]. https://api.worldbank.org/v2/country?format=json&per_page=400
Figure 13 (b):
Our World in Data. (n.d.). Energy dataset [Dataset]. https://github.com/owid/energy-data
Our World in Data. (n.d.). Child mortality rate [Dataset]. https://ourworldindata.org/grapher/child-mortality
World Bank. (n.d.). Country metadata API [Dataset]. https://api.worldbank.org/v2/country?format=json&per_page=400
Figure 14 (a):
Our World in Data. (n.d.). Energy dataset [Dataset]. https://github.com/owid/energy-data
Our World in Data. (n.d.). Death rates from air pollution [Dataset]. https://ourworldindata.org/grapher/death-rates-from-air-pollution
World Bank. (n.d.). Country metadata API [Dataset]. https://api.worldbank.org/v2/country?format=json&per_page=400
Figure 14 (b):
Our World in Data. (n.d.). Energy dataset [Dataset]. https://github.com/owid/energy-data
Our World in Data. (n.d.). Death rates from air pollution [Dataset]. https://ourworldindata.org/grapher/death-rates-from-air-pollution
World Bank. (n.d.). Country metadata API [Dataset]. https://api.worldbank.org/v2/country?format=json&per_page=400
Figure 14 (c):
Our World in Data. (n.d.). Energy dataset [Dataset]. https://github.com/owid/energy-data
Our World in Data. (n.d.). Death rates from unsafe water sources [Dataset]. https://ourworldindata.org/grapher/death-rates-unsafe-water
World Bank. (n.d.). Country metadata API [Dataset]. https://api.worldbank.org/v2/country?format=json&per_page=400
Figure 14 (d):
Our World in Data. (n.d.). Energy dataset [Dataset]. https://github.com/owid/energy-data
Our World in Data. (n.d.). Death rates from unsafe water sources [Dataset]. https://ourworldindata.org/grapher/death-rates-unsafe-water
World Bank. (n.d.). Country metadata API [Dataset]. https://api.worldbank.org/v2/country?format=json&per_page=400

For more of our research and scholarship, visit our
website: www.advancingamericanfreedom.com.
This paper updates and extends prior research co-authored by one of the authors of this report; see Dayaratna et al. (2023). ↑
"Developed" and "Developing" country categorizations follow the World Bank's income classification by GNI per capita (Atlas method): high-income economies (2024 threshold: >$14,005) are grouped as developed, and upper-middle, lower-middle, and low-income economies are combined as developing. The 2024 classification is applied to all historical years to prevent countries from changing categories over time. The full country roster is available upon request. See World Bank (n.d.). ↑