Policy Memo
Topline
One year after Liberation Day, tariff data shows significant employment declines across key American industries.
Authors: Joel Griffith, Kevin Dayaratna, Ph.D., and Richard Stern
The April 2025 Liberation Day tariffs were the largest increase in effective U.S. tariff rates in decades, enacted through emergency executive authority that the Supreme Court later found unconstitutional. This paper evaluates the policy's economic and employment consequences. This paper combines historical context, economic theory, and legal developments to explain the channels through which tariffs affect employment—higher input costs, supply chain disruptions, and retaliatory trade barriers—and then test these predictions using monthly sector-level employment data from the Bureau of Labor Statistics. Our descriptive analysis shows that employment growth across most sectors was generally positive before Liberation Day but weakened markedly afterward, with persistent slowdowns in manufacturing and trade-related industries. We then estimate a hierarchical Bayesian statistical model, which confirms these patterns and provides strong evidence of a sustained deterioration in employment growth following the policy. The slowdown is driven by a broad-based decline in hiring rather than a one-time drop in employment levels, and it remains robust to demographic controls. Taken together, the historical record, economic theory, and our empirical findings point to a consistent conclusion: the Liberation Day tariffs did not generate the intended employment gains and instead coincided with a widespread deceleration in job growth across the U.S. economy during the policy's first year.
The second Trump administration has placed a significant emphasis on trade policy, frequently framing tariffs as a means of supporting domestic employment and manufacturing. Supporters argue that tariffs can protect domestic producers and encourage job creation, while critics warn that trade barriers may raise costs and disrupt economic activity (Goldsberry, 2025; Donovan, 2024; Brill & Cheema, 2025). With the policy now implemented, the relevant empirical question is how employment dynamics evolved across industries before and after the intervention.
In April 2025, the Trump administration implemented a new set of tariffs commonly referred to as “Liberation Day,” explicitly framed as a measure to strengthen domestic employment (The White House, 2025a). Importantly, evaluating such a policy requires differentiating short-term volatility from changes in the underlying direction of employment growth and accounting for differences across sectors with varying exposure to trade and labor-market conditions.
The remainder of the paper proceeds as follows. We begin by situating the Liberation Day tariffs within the broader historical and institutional context of U.S. trade policy, including the post-NAFTA period of trade liberalization, the legal basis for the tariffs, and the subsequent constitutional challenges that culminated in the Supreme Court’s ruling. We then outline the core economic mechanisms through which tariffs are expected to affect employment, emphasizing the roles of input costs, supply chain integration, and retaliatory trade barriers. Building on this foundation, we present a descriptive analysis of post-pandemic employment trends across sectors to document how labor market dynamics evolved around the policy intervention. We then formalize these patterns using a hierarchical Bayesian event- study framework, which allows us to assess whether the underlying trajectory of employment growth shifted following Liberation Day while accounting for sector- specific heterogeneity. Finally, we interpret the empirical findings in light of the theoretical and historical evidence and discuss their implications for trade policy, employment dynamics, and the institutional design of tariff authority in the United States.
To understand the magnitude of what happened on April 2, 2025, it is necessary to appreciate what came before. The three decades following the enactment of the North American Free Trade Agreement (NAFTA) in 1994 produced one of the most sustained expansions of prosperity in American economic history. U.S. exports nearly tripled in inflation-adjusted terms, reaching more than $2 trillion annually (U.S. Bureau of Economic Analysis, n.d.-e). American manufacturing output—contrary to the popular narrative of decline—rose by more than half and achieved all-time highs. Middle-class real family income increased by more than $28,000 in inflation- adjusted terms (U.S. Census Bureau, n.d.-a). Labor force participation among prime- working-age adults (25–34) increased (U.S. Bureau of Labor Statistics, n.d.-c). Foreign direct investment, partly attracted by the stability and openness of the American market, exploded by more than 500 percent in just seven years, reaching in excess of $320 billion in 2000 (Board of Governors of the Federal Reserve System, n.d.-c) The trade deficit that critics have long decried was not a symptom of economic weakness. It was the mirror image of the capital surplus flowing back to the United States—financing government borrowing at lower interest rates and funding the private investment that drove productivity growth. For low-income families, tariff reductions represented perhaps one of the largest tax reductions in history.
This was the backdrop against which the Liberation Day tariffs arrived: an American economy that had grown more productive, more export-oriented, and more deeply integrated into global supply chains with each passing year.
On February 10, 2025, the Trump administration released its “Fair and Reciprocal” trade plan, signaling an imminent departure from the post-NAFTA trade consensus (National Taxpayers Union, n.d.). The document framed the U.S. trade deficit as evidence of systemic exploitation by trading partners and argued that higher tariffs were both economically justified and legally available under the president's emergency powers. The plan attracted immediate skepticism from economists, who noted that despite the name, trade deficits do not reflect a troublesome imbalance or provide any insight into the fairness of any bilateral trade relationship.
Mythology and falsehoods inspired the Liberation Day tariffs: the trade deficit is harmful and represents theft (Sullum, 2025), loss of manufacturing employment is caused by unfair competition rather than technological advancement (Council on Foreign Relations, 2025), our industrial base is hollowed out (Council on Foreign Relations, 2025), protectionism can revive mid-century employment patterns in a twenty-first-century economy (CNBC, 2017), and the middle-class of today is less prosperous than 40 years ago (Boak et al., 2025). Despite the fact that these claims are not supported by the economic evidence, the administration's flawed premises on the trade deficit underpinned much of the legal and constitutional controversies that followed.
On April 2, 2025 (branded by the White House as “Liberation Day”), President Trump signed an executive order declaring the U.S. trade deficit a national emergency and invoking the International Emergency Economic Powers Act (IEEPA) to impose a sweeping new tariff regime (National Taxpayers Union, n.d.; The White House, 2025b). The order established a 10 percent baseline tariff on imports from all countries, with higher “reciprocal” rates applied to nations identified as maintaining the largest bilateral surpluses with the United States. These country-specific rates included: China at 34 percent, the European Union at 20 percent, Japan at 24 percent, Vietnam at 46 percent, Cambodia at 49 percent, and dozens of additional trading partners at elevated levels. White House Annex I provided the full schedule of country-specific rates (The White House, 2025b). The rates were not, in fact, derived from any calculation of foreign tariff barriers; they were computed by dividing the bilateral trade deficit by total bilateral imports. In reality, the U.S. even before Liberation Day, imposed overall tariffs higher than those imposed on our exports. This approach has no foundation in trade economics and produced rates far exceeding any credible measure of foreign protectionism.
As a point of historical comparison: Trump's Liberation Day tariffs raised the average effective U.S. tariff rate by nearly 20 percentage points from a baseline of approximately 3 percent. This sevenfold increase was three times the magnitude of the tariff jump associated with the Smoot-Hawley Tariff Act of 1930, which economists across the spectrum credit with deepening the Great Depression (Fortune, 2025). At peak, the effective tariff rate reached 14.3 percent, the highest since 1939 (The Budget Lab, 2026).
Financial markets responded immediately and severely. Between April 2 and April 9, the S&P 500 fell approximately 12.4 percent (Yahoo Finance, n.d.). This was the largest single-week decline since the onset of the COVID-19 pandemic. Bond markets were equally turbulent: the three-day increase in the 30-year Treasury yield was the largest since 1982, reflecting investor concerns about both inflation and the long-term fiscal cost of a protracted trade war (Board of Governors of the Federal Reserve System, n.d.-b).
U.S. trading partners moved rapidly to retaliate. China imposed tariffs of 84 percent on U.S. goods (Axios, 2025; Kelley Drye, n.d.). Canada announced retaliatory tariffs on approximately $155 billion worth of U.S. exports (Axios, 2025; Kelley Drye, n.d.) The European Union imposed 25 percent tariffs on a broad range of American products. These countermeasures fell disproportionately on American agricultural exporters— farmers in Iowa, Nebraska, Ohio, and Texas who had built their livelihoods around the export markets opened by decades of trade liberalization. The same farmers for whom trade had made prosperous became the most direct casualties of the retaliatory response.
The Supreme Court's 6-3 decision on February 20, 2026, striking down the IEEPA tariffs, carries implications that extend beyond the legal questions at stake (SCOTUSblog, 2026; Holland & Knight, 2026). Chief Justice Roberts’s opinion— holding that IEEPA does not authorize tariffs and that their imposition would represent a “transformative expansion” of presidential authority—vindicated the constitutional argument that critics of the tariffs had made from the beginning: that Congress never intended to surrender its Article I, Section 8 power to impose tariffs when it enacted IEEPA, and that allowing the executive branch to deploy emergency economic powers to restructure the entire architecture of U.S. trade policy would effectively nullify the constitutional assignment of trade authority to the legislative branch. In fact, Congress has provided several narrow and specific standing statutory authorities to impose tariffs, such as Sections 232 (Trade Expansion Act of 1962, 1962), 201 (Trade Act of 1974, 1974), 301 (Trade Act of 1974, 1974), 122 (Trade Act of 1974, 1974), and 338 (Tariff Act of 1930, 1930).
The constitutional issue is not merely procedural. When tariff policy is made through executive emergency declarations rather than through the deliberative legislative process, it lacks the accountability and stability that trade policy requires to function effectively. Businesses cannot make long-term investment decisions on the basis of a tariff structure that can be imposed and withdrawn at presidential discretion, challenged in court, and ultimately invalidated by judicial review. The legal uncertainty surrounding the Liberation Day tariffs was itself a source of economic damage, as the volatility in financial markets and the spike in Treasury yields during April 2025 made clear. A tariff regime that is constitutionally grounded in congressional action, debated through normal legislative procedures, and subject to modification through the same process, is far more conducive to the investment and planning that sustained employment growth requires.
The empirical analysis presented in the sections that follow documents changes in U.S. employment in the period surrounding the Liberation Day tariffs. It is worth examining the economic logic that led most labor economists and trade economists to accurately predict that these tariffs would prove harmful to employment. This proved true specifically in the manufacturing sector, ostensibly targeted for rejuvenation by the policy. Understanding these mechanisms is essential for interpreting the data correctly and for evaluating whether any observed employment changes are consistent with the predictions of economic theory.
The mechanisms of input cost increases, supply chain disruption, retaliatory barriers to export markets, regressive consumer price increases, and misallocation of labor toward lower-productivity sectors all operate in the same direction with respect to employment. They reduce it, or they change its composition in ways that leave workers worse off. The data analysis presented in this paper tests whether, and to what degree, these predicted effects materialized in the months following Liberation Day. As we demonstrate, the employment record for the affected period is consistent with the theoretical predictions: Tariffs did not produce the manufacturing renaissance their proponents promised, and measurable employment effects are observable in precisely the channels the economic literature would lead one to expect.
These theoretical mechanisms generate clear predictions about how employment should respond following Liberation Day. We now turn to the data to examine whether these predicted patterns have been visible in aggregate and sectoral employment dynamics.
Ironically, protectionism harms the very sector intended to be a primary beneficiary of the policy. Alas, modern American manufacturing utilizes imported inputs at every stage of production. Tariffing steel, for instance, raises production costs for domestic automakers, appliance manufacturers, and construction firms in need of that steel. Rising input costs result in higher consumer prices and diminished competitiveness globally, even driving some into bankruptcy. As seen in Figure 1 below, on average, over half the value of all goods imported into the U.S. are non-automative capital goods and industrial supplies and materials (U.S. Bureau of Economic Analysis, n.d.- d). Capital goods are goods used to produce both goods and services, while industrial supplies and materials are used by manufacturers as inputs to their production – converting simpler inputs into more complex outputs, such as turning aluminum into aerospace parts and vehicles.

Generally, the real volume of industrial supply imports and overall U.S. manufacturing output track closely with one another, as can be seen in Figure 1 below (U.S. Bureau of Economic Analysis, n.d.-f). The U.S. manufacturing sector sits at the high end of the value chain and so, counterintuitively to some, imports are crucial complements, not competitors, with U.S. manufacturers.

The automobile sector illustrates this dynamic. U.S. automotive competitiveness relies on deeply integrated North American supply chains enabling components to easily cross international borders multiple times before final production at an American assembly plant. Tariffs on components sourced from Canada, Mexico, or East Asia raise the cost of the finished vehicle and reduce U.S. competitiveness in global export markets. This yields layoffs, plant closures, and production relocation. None of these responses produces a net gain in employment. Tariffs cannot revive American manufacturing employment because they diminish the competitiveness of domestic manufacturers.
Retaliatory tariffs by trading partners worsen the problem by losing export market access in addition to losing their competitive edge. This especially harms agricultural producers. China's 84 percent retaliatory tariffs on U.S. goods, Canada's action against $155 billion of U.S. exports, and the European Union's 25 percent retaliatory tariffs together shut large portions of the U.S. export market to American producers (Axios, 2025; Kelley Drye, n.d.).
Tariffs are taxes. And these tariffs are not paid by foreign governments or foreign businesses. The U.S. Treasury collects this tax at the border. It’s paid by domestic importers and passed along in the form of higher prices to American consumers and businesses. Approximately 90 percent of the 2025 tariff burden fell on domestic importers rather than being absorbed by foreign exporters through reduced profit margins. This mirrors the experience of the 2018–2019 steel and aluminum tariffs (Brookings Institution, 2026).
Formal government statistics on import prices typically leave out the added cost of tariffs. While this is done to separate out the impact of government action, it also helps to obscure the true cost placed on Americans by tariffs. In Figure 3 below, we have constructed an import price deflator for the cost of imported goods that include the cost of the goods themselves and the customs duties (tariffs) levied on them. (U.S. Bureau of Economic Analysis, n.d.-c; U.S. Bureau of Economic Analysis, n.d.-a; U.S. Bureau of Economic Analysis, n.d-b).

Whereas the non-tariff inclusive import price deflator shows only a 0.05 percent increase in prices from 2024 to 2025, by including tariffs, we can see that the true price increase seen by American importers was 5.26 percent (U.S. Bureau of Economic Analysis, n.d.-c).
The top-line economic data from 2025 reflect these dynamics. Investment in new manufacturing capacity declined by nearly 15 percent following Liberation Day (U.S. Census Bureau, n.d.-b). Economic growth slowed to 2.12 percent—the weakest of the post-COVID era and ranking just 14th out of the past twenty years (U.S. Bureau of Economic Analysis, n.d.-g). Since March 2025, private employment increased by only 325,000, with total job gains for the year reaching just 601,000—among the weakest outside of the COVID shutdown period (U.S. Bureau of Labor Statistics, n.d.-b). At the same time, the number of full-time jobs declined by more than 700,000, and the manufacturing sector lost jobs in every month of 2025 (U.S. Bureau of Labor Statistics, n.d.-e). Labor force participation also fell from 62.5 percent to 62.0 percent, representing roughly 1.4 million working-age individuals leaving the labor force (U.S. Bureau of Labor Statistics, n.d.-f). Notably, these declines cannot be attributed to changes in immigration enforcement; native-born employment itself fell by more than 200,000, and the regression analysis presented below confirms that such demographic factors had no meaningful effect on overall employment outcomes (U.S. Bureau of Labor Statistics, n.d.-h).
While tariffs impose economy-wide costs, their burden is not evenly distributed. Tariffs are among the most regressive forms of taxation available to the federal government. Unlike income taxes, which are progressive, tariffs raise the prices of goods that all households must purchase. Lower-income households, which spend a larger share of their income on consumption, therefore bear a disproportionately large share of the burden.
This regressivity is an inherent feature of tariff policy. When the prices of clothing, electronics, automobiles, and food rise, the impact falls most heavily on families with the least financial flexibility. For many households, the added costs from tariffs exceed the savings from the tax cuts included in the One Big Beautiful Bill (OBBB). Recent estimates indicate that tariffs increased inflation by approximately 0.5 percentage points and cost the average American family about $1,000 in 2025 alone (York & Durante, 2026). If maintained, the full tariff package could have imposed annual costs of up to $3,800 per household, with bottom-quintile households absorbing roughly $1,700 of that burden (Yale Budget Lab, n.d.).
Tariff revenue reached $265 billion in 2025—triple the 2024 dollar level and roughly 75 percent larger as a share of GDP than at the height of the Smoot-Hawley tariff era—underscoring that these policies function primarily as a tax on American consumers and businesses rather than as a penalty on foreign governments (Lawder, 2026). In effect, the Liberation Day tariffs delivered the outcome long predicted by economic theory: higher prices, substitution of lower-quality inputs, disrupted supply chains, weaker investment and employment growth, and a transfer of income from consumers and downstream industries to the producers favored by the government through the tariff wall (Baker McKenzie, 2025).

Even if tariffs successfully shifted production from foreign factories to domestic ones, a premise the data do not support, the employment gains would be far more modest than promised by proponents. The manufacturing sector of the twenty-first century is far less labor-intensive than just a few generations ago. Automation enables far more output per worker than at any previous point in American history. Investors, workers, and consumers alike share the benefits of this productivity surge.
U.S. manufacturing and industrial output has increased by more than half since 1994 and today approaches all-time highs. Yet manufacturing employment is substantially lower than it was in the 1970s or 1980s, as seen in Figure 5 below (Board of Governors of the Federal Reserve System, n.d.-a). Manufacturing employment as a share of total non-farm employment steadily declined between 1953 and 2009.
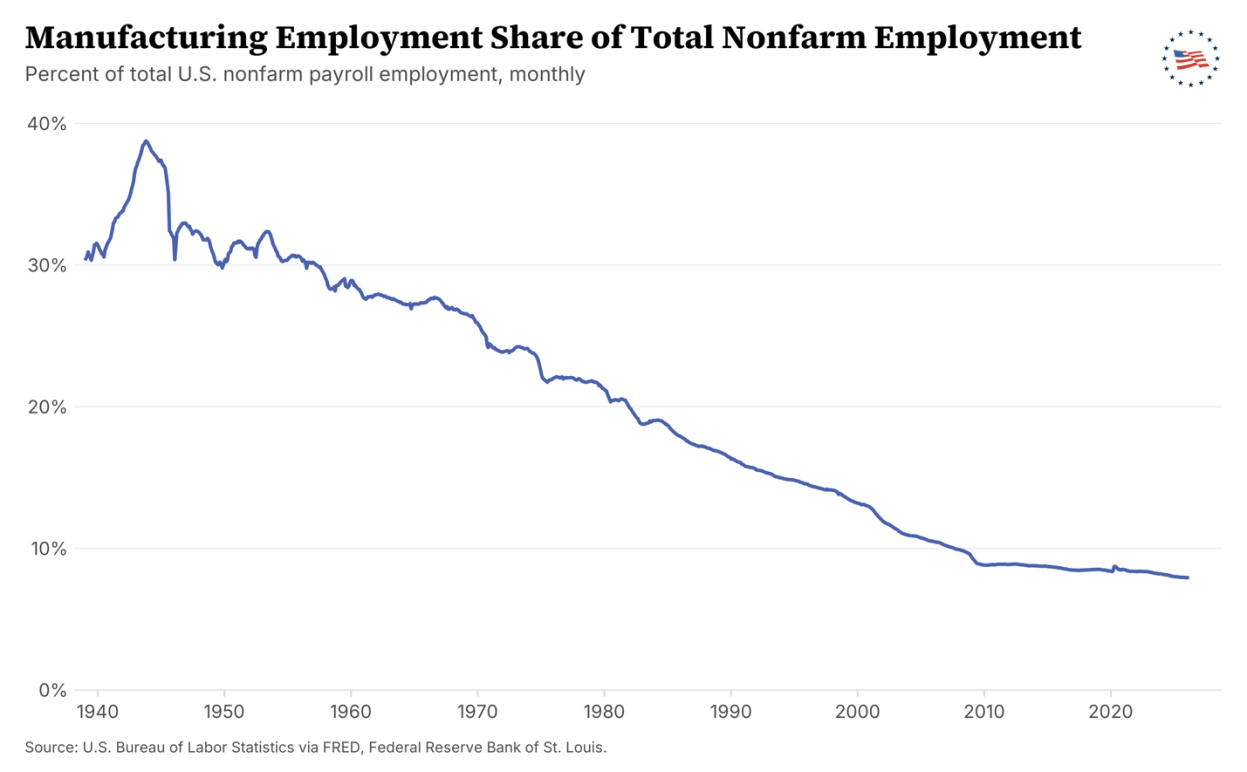
The cause is not trade; it is technology. Computer-controlled manufacturing equipment, robotics, and advanced logistics systems have enabled American factories to produce far more with far fewer workers. Any domestic manufacturing revival induced by tariffs will therefore generate far fewer jobs than a naïve extrapolation from output levels would suggest. Of course, the benefits to a select few will be dwarfed by the job losses elsewhere due to the higher costs and distortions by tariffs across the entire economy.
Lost in the nostalgic yearning for more manufacturing jobs is the fact that these jobs typically pay less than the average American job across other sectors. The flow of labor and capital since NAFTA into higher-productivity sectors has driven growth in real family income over the past 32 years. Since NAFTA was implemented, real median weekly wages have increased by 19 percent, whereas they declined by 5 percent in the 15 years prior to NAFTA’s implementation. (U.S. Bureau of Economic Analysis, n.d.-f) The U.S. gained jobs in higher paying sectors where the United States has a comparative advantage as lower-paying manufacturing jobs shifted elsewhere. Reallocating labor and capital into lower-productivity, tariff-protected manufacturing lowers average wages even if headline employment levels remained unchanged.
The Liberation Day tariffs were not the first time the United States attempted to use broad import barriers to protect domestic industry. The Smoot-Hawley Tariff Act of 1930 raised average tariff rates to roughly 45 to 50 percent, triggered retaliation from dozens of U.S. trading partners, and contributed materially to the collapse of global trade that deepened and prolonged the Great Depression. U.S. imports fell by two- thirds between 1929 and 1932; U.S. exports fell by a similar magnitude as retaliatory barriers shut off American markets abroad. This episode demonstrated that tariff escalation is counterproductive. This painful experience informed U.S. trade policy for the better part of a century.
The Liberation Day tariffs represented the largest single-episode increase in effective tariff rates since Smoot-Hawley, approximately three times the magnitude of that Act's tariff jump as a share of the existing rate structure (Fortune, 2025). The same retaliatory dynamics that Smoot-Hawley triggered repeated themselves within days of the April 2 announcement. The extent to which the macroeconomic consequences ultimately parallel the 1930s experience depends on the duration and resolution of the current trade conflict. Regardless, the mechanism of harm transmittal is identical: higher domestic prices, reduced export market access, supply chain disruption, and a general contraction in the volume of mutually beneficial exchange.
The historical record and economic theory provide a clear set of expectations about how employment should respond to a sharp increase in trade barriers. Episodes such as Smoot–Hawley illustrate that tariff escalation tends to weaken economic activity through well-understood channels, including higher input costs, retaliatory trade measures, and disruptions to established production networks. The question, then, is whether the labor market dynamics surrounding Liberation Day reflect these same patterns. To address this, we begin with a descriptive examination of employment data across sectors, focusing on how job growth evolved in the period leading up to and following the April 2025 policy intervention. This exploratory analysis provides a transparent, data-driven foundation for the formal econometric analysis that follows.
We begin with a descriptive examination of aggregate and sectoral employment changes surrounding Liberation Day. We use monthly sector-level employment data from the Bureau of Labor Statistics’ Current Employment Statistics (CES) program. All series are seasonally adjusted. Figure 6 presents a two-panel depiction of monthly employment dynamics since June 2022, with aggregate employment shown in the left panel and sectoral employment changes shown in the right panel based on data from the Bureau of Labor Statistics:1 1 Post-COVID recovery is defined as the first month in which employment returns to its pre-pandemic peak level and remains at or above that level for three consecutive months, ensuring that recovery reflects a sustained return rather than a transitory fluctuation. Methodological details as to how this was determined are contained in the appendix. Data was downloaded from https://fred.stlouisfed.org, https://www.bls.gov/ces/.

As Figure 6 illustrates, total nonfarm employment grew since 2022, with levels of gains fluctuating over time. In particular, total employment started out at slightly above 152 million jobs in June 2022, growing steadily through April 2025 to 159 million jobs. After Liberation Day on April 2, 2025, however, employment gains declined sharply. Overall, however, the economy still had a total of 159 million jobs a year after Liberation Day.

Figure 7 depicts monthly changes in manufacturing employment since June 2022, again with aggregate manufacturing employment shown in the left panel and sectoral employment changes shown in the right panel.
As Figure 7 illustrates, manufacturing employment grew from around 12.77 million in June 2022 and reached a peak of around 12.9 million jobs around the beginning of 2023 but has dropped precipitously since then. Since December 2022, 14 of the following 28 months until Liberation Day noted manufacturing job losses. By April 2025, manufacturing employment was slightly below where it had started in June 2022 at 12.77 million jobs. After Liberation Day, however, manufacturing jobs only continued to shrink. Across the first year of Liberation Day tariffs (April 2025 through March 2026), manufacturing employment shrank by approximately 6,250 jobs monthly on average.
Manufacturing employment has been on the decline in America for several decades. As discussed earlier in this report, the manufacturing sector employs fewer workers today than it did in 1970; however, this fact reflects long-run productivity gains rather than a decline in industrial capacity. The United States remains the global leader in manufacturing value added per worker. Advances in technology have allowed firms to produce far more with fewer employees, a dynamic clearly illustrated in sectors such as steel, where output per worker has increased dramatically over time.
Regardless, the purported intent of tariffs on Liberation Day was supposedly to bring back manufacturing employment in America. (Trump, 2025) Such policies should be evaluated on their empirical performance rather than their stated objectives. As shown in Figure 7, manufacturing employment failed to exhibit sustained growth following “Liberation Day,” despite the policy’s stated aim of expanding domestic manufacturing jobs. Monthly employment changes in the sector were consistently negative in the post-policy period, indicating that the intervention did not reverse— or even measurably alter—the underlying employment trend. In short, while U.S. manufacturing remains highly productive and globally competitive, policies designed to resurrect manufacturing employment through trade restrictions have not delivered the promised labor-market outcomes.
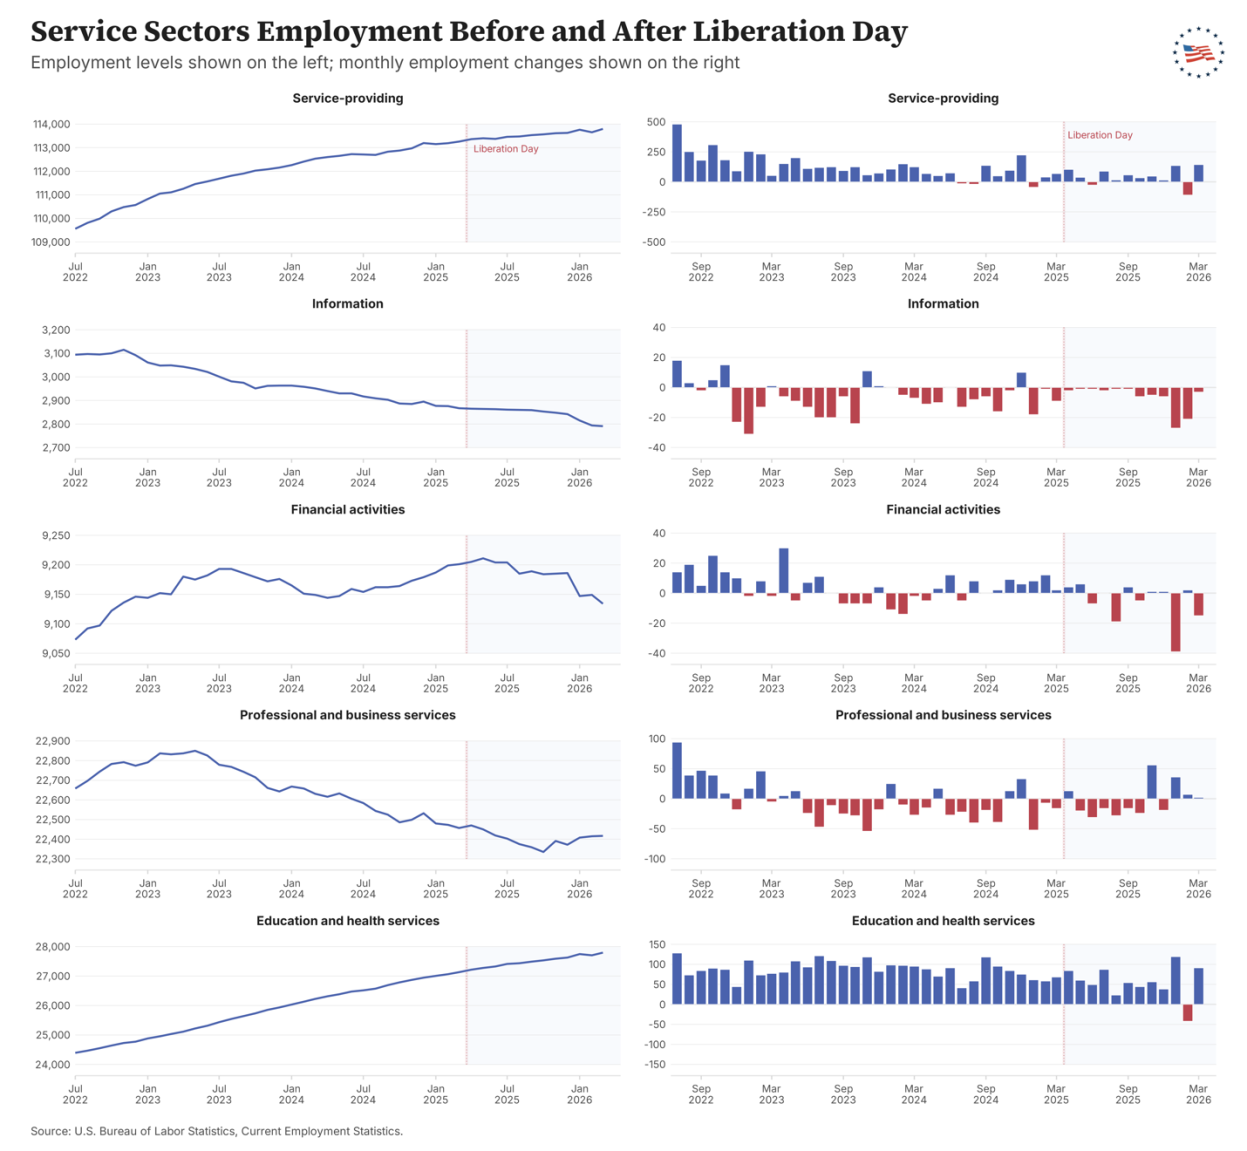
Figures 12–15 in the Appendix present employment levels and monthly employment changes across additional sectors of the economy. With the exception of three service industries—education and health services, leisure and hospitality, and other services—the data show little evidence of employment gains following Liberation Day. Across all other sectors, the descriptive evidence reveals a consistent pattern. Prior to Liberation Day, monthly employment changes, though uneven, were generally sufficient to support rising employment levels. After Liberation Day, monthly job growth weakened sharply across many sectors and, in several cases, became persistently negative. Over time, these weaker monthly flows translated into stagnation or outright declines in employment levels.
Taken together, the data provides no evidence that Liberation Day tariffs succeeded in reviving employment. If anything, the post-event period is characterized by continued and persistent job losses, reinforcing the view that trade restrictions alone are insufficient to reverse structural employment trends, including in manufacturing.
These descriptive patterns motivate the formal econometric analysis that follows, which assesses whether the observed post–Liberation Day changes remain statistically and economically meaningful after accounting for underlying trends and sector-specific heterogeneity.
This section formalizes the descriptive evidence using a hierarchical Bayesian event- study framework to assess how employment trends evolved following the April 2025 “Liberation Day” tariff intervention. Rather than focusing on short-run month-to- month fluctuations, the model is designed to detect whether the underlying trajectory of employment growth shifted after the policy event, while allowing for heterogeneous responses across sectors.
The empirical strategy builds a piecewise linear event-study specification in which sector-level employment is modeled as a function of a pre-event time trend and a post-event change in slope. This structure allows employment growth to evolve smoothly before the intervention while permitting a persistent change in trend following Liberation Day. By estimating both pre- and post-event dynamics within a single unified model, the framework distinguishes temporary volatility from sustained changes in employment growth rates—an essential distinction when evaluating policies whose effects may accumulate gradually over time.
We employ a hierarchical Bayesian approach to accommodate substantial cross- sector heterogeneity while retaining statistical power. Sector-specific coefficients are allowed to vary, but are partially pooled toward common aggregate effects, yielding stabilized estimates for both individual industries and the economy as a whole. This multilevel structure is particularly well suited to the present setting, where sectors differ markedly in size, volatility, and exposure to trade policy, yet are subject to the same policy shock at a common point in time. Identification of the policy effect comes from comparing pre- and post-event trends within sectors, with partial pooling improving precision across heterogeneous industries. The resulting estimates therefore provide a coherent event-study assessment of whether Liberation Day altered employment trajectories across the U.S. economy, and if so, whether those changes were broad-based or concentrated in specific sectors.
The analysis uses a balanced monthly panel of sector-level employment from the U.S. Bureau of Labor Statistics’ Current Employment Statistics (CES) program and from the Federal Reserve of St Louis’s Federal Reserve Economic Data (U.S. Bureau of Labor Statistics, n.d.-i; Federal Reserve Bank of St. Louis). While employment is measured in levels, the model is estimated on a sector-demeaned outcome to focus on within-sector changes over time. Because the dependent variable is centered within sector prior to estimation, intercept terms capture common level effects under the hierarchical specification, while slope parameters governing pre- and post-event trends are unaffected by the centering transformation. The sample spans the pre- and post–Liberation Day period, with the post-event window covering the first year of Liberation Day tariffs (April 2025 through March 2026), and includes time-varying controls for native and foreign-born population, both of which are demeaned within sector and then globally standardized prior to estimation.
The sectors included in the analysis are construction, manufacturing, mining and logging, wholesale trade, retail trade, transportation and warehousing, utilities, information, financial activities, professional and business services, education and health services, leisure and hospitality, and other services. These sectors together account for the vast majority of private nonfarm employment and represent the portions of the labor market most plausibly affected by trade policy shocks such as the Liberation Day tariffs.
For sector s and month t, employment ys,t is centered over sector-level means to obtain the demeaned outcome ŷs,t as follows:

where μs,t is our linear predictor defined below, following a piecewise-linear event-study specification:

Two time-varying control variables are included in the above linear predictor, namely the native- and foreign-born populations, designated as 𝑃𝑂𝑃𝑁𝐴𝑇𝐼𝑉𝐸𝐵𝑂𝑅𝑁 and 𝑃𝑂𝑃𝐹𝑂𝑅𝐸𝐼𝐺𝑁𝐵𝑂𝑅𝑁 respectively2 Here, t indexes months, 𝑡𝑐 denotes time centered at the sample mean month, 𝑡0 denotes the time of interest (Liberation Day in April 2025), and 𝟙(·) is an indicator variable for post-event months.
For each sector s, define the vector of sector-level coefficients Δs:

• αₛ: baseline employment level for sector s • βₛ: pre-event employment trend for sector s • 𝛿𝑆: discrete change in the level of employment in sector s at the time Liberation Day occurs, holding the pre-event trend fixed.
• γₛ: post–Liberation Day change in slope for sector s • 𝜃𝑃𝑂𝑃𝑁𝐴𝑇𝐼𝑉𝐸𝐵𝑂𝑅𝑁,𝑠: sector-specific association between employment changes and the native-born population • 𝜃𝑃𝑂𝑃𝐹𝑂𝑅𝐸𝐼𝐺𝑁𝐵𝑂𝑅𝑁,𝑠: sector-specific association between employment changes and the foreign-born population.
2 𝑃𝑂𝑃𝑁𝐴𝑇𝐼𝑉𝐸𝐵𝑂𝑅𝑁 and 𝑃𝑂𝑃𝐹𝑂𝑅𝐸𝐼𝐺𝑁𝐵𝑂𝑅𝑁 are demeaned and then scaled by their standard deviation prior to estimation.
And below we discuss our first-order autoregressive error structure. We assume:

with initial condition:

specifying the following AR(1) sector-specific regularized positive-persistence prior:

This component captures short-run persistence in monthly employment data and is included to ensure appropriate uncertainty quantification, while the policy effect is identified through changes in pre- and post-event trends.
Conditional on hyperparameters, sector-level coefficients are assumed to be independent draws from normal distributions:


These first-stage priors formalize partial pooling across sectors: when σk² for k ∈ {α, β, δ, γ, θ} is small, sector estimates shrink toward the pooled mean; when τ is large, greater heterogeneity is allowed. For computational efficiency, we implement the model using a non-centered parameterization:

Hyperpriors on pooled means and dispersions are weakly informative:

And regarding the autoregressive component of the model:

And the following error-model prior:

We estimated model parameters using Markov chain Monte Carlo (MCMC) simulation with the No-U-Turn Sampler (NUTS), a Hamiltonian Monte Carlo algorithm designed for efficient exploration of high-dimensional posterior distributions (Hoffman & Gelman, 2014; Neal, 2011). The model was estimated using four independent chains, each run for a total of 32,000 iterations. The initial 3,000 iterations of each chain were discarded as warm-up (burn-in) to allow the sampler to adapt, leaving 5,000 retained draws per chain and thus 20,000 remaining posterior draws in total. Sampling settings were chosen to promote numerical stability and thorough exploration of the parameter space, and all reported results are based on the post-warm-up samples3
This section summarizes the results of the hierarchical Bayesian model. Figure 8 reports estimates of marginal posterior densities, alongside 95 percent credible intervals with posterior sign probabilities estimated from the full joint posterior distribution.

3 As a supplemental check, the model was also estimated using variational Bayesian methods. The resulting point estimates and qualitative conclusions were substantively similar to those obtained via MCMC, providing additional reassurance that the findings are not sensitive to the choice of estimation technique. For more, see Blei et al. (2017).
Table 1 reports pooled posterior summaries for the key parameters of the hierarchical Bayesian event-study model. These estimates quantify average employment dynamics across sectors before and after Liberation Day, while accounting for cross-sector heterogeneity and uncertainty.
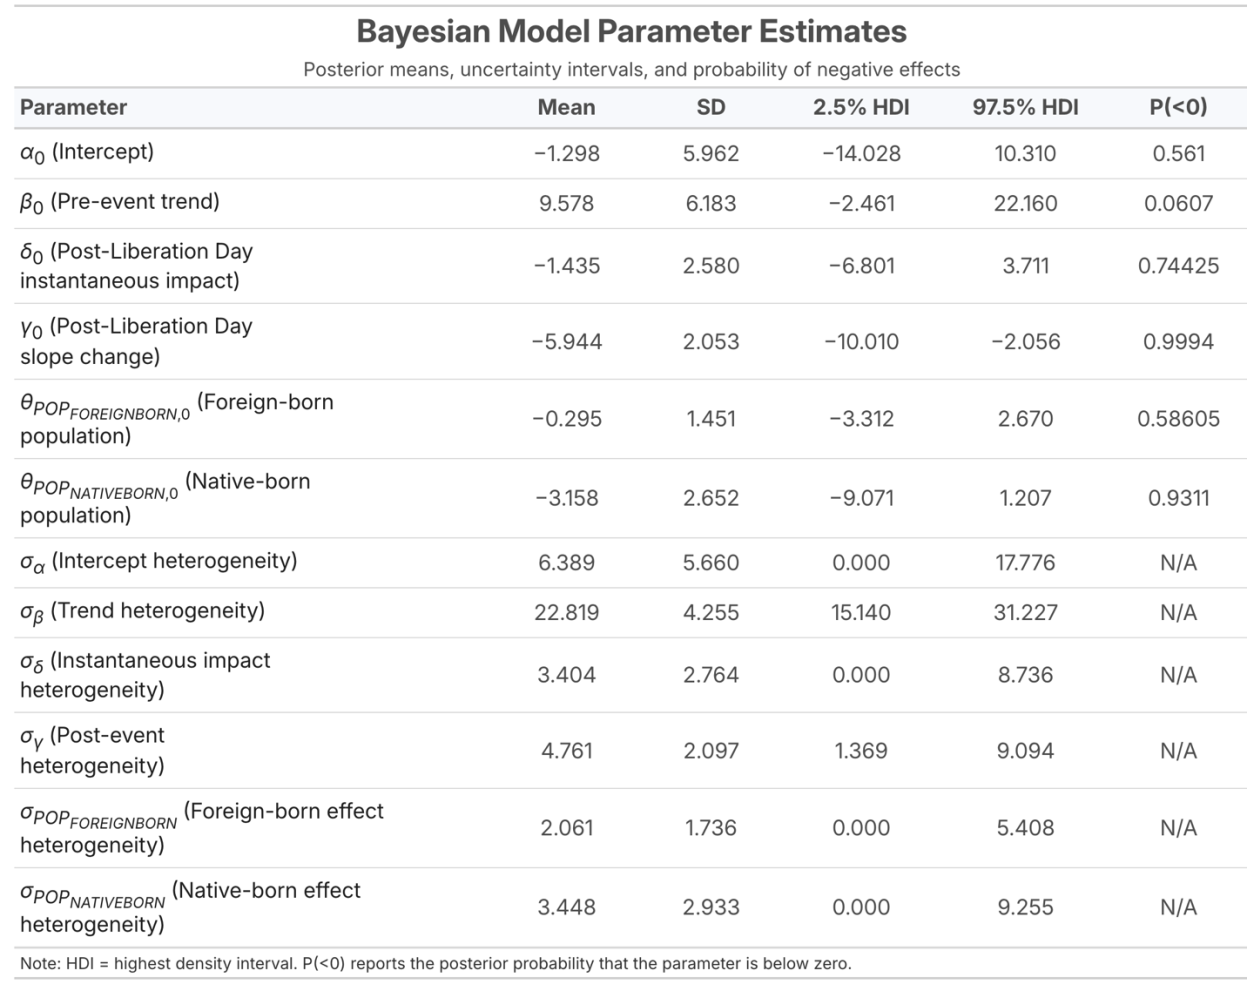
The pooled intercept parameter, 𝛼0, has a posterior mean of -1.2988 with a posterior standard deviation of 5.962 and a 95 percent highest-density interval (HDI) of [- 14.028, 10.31]. Although employment is centered within sector prior to estimation, 𝛼0 is not constrained to zero under the hierarchical specification and absorbs common level effects across sectors not captured by time trends or population controls. Given the wide HDI spanning zero, this parameter plays no direct role in identifying post-event changes in employment trajectories.
The pooled pre-event trend parameter 𝛽0 indicates that employment growth was positive on average prior to Liberation Day. The posterior mean of 𝛽0 is 9.578 (thousand jobs per month), with a posterior standard deviation of 6.183 and a 95 percent HDI of [-2.461, 22.161]. Although the credible interval narrowly overlaps zero, the posterior probability that 𝛽0 is positive exceeds 93 percent, indicating strong evidence of positive employment growth across sectors in the pre-policy period. This result establishes a positive baseline againsth post-event changes can be meaningfully evaluated.
In contrast, the pooled post–Liberation Day slope change parameter, 𝛾0, is estimated to be both large and precisely negative. The posterior mean of 𝛾0, is – 5.944, with a posterior standard deviation of 2.053 and a 95 percent HDI of [–10.01, – 2.056]. Importantly, more than 99.9 percent of posterior mass lies below zero. This estimate indicates a pronounced and persistent deterioration in employment growth following Liberation Day.
In practical terms, the pooled estimate implies that, on average across sectors, monthly employment growth slowed by approximately 5,900 jobs relative to the pre-policy trend. Scaling these effects across sectors suggests a substantial economy-wide slowdown in job creation: on the order of 75,000 to 80,000 fewer jobs per month, or roughly 900,000 fewer jobs over a year relative to the pre- Liberation Day trajectory. As a rough comparison, this is far more than the combined decline of federal employment by roughly 330,000, as a direct result of policy changes, and the decline of roughly 𝛾0251,000 employed foreign born workers in the U.S. since the Liberation Day tariffs were imposed (U.S. Bureau of Labor Statistics, n.d.-a; U.S. Bureau of Labor Statistics, n.d.-f).4 This, of course, assumes that none of these former federal workers would have been able to find other employment. As such, these figures highlight both the scale and the broad-based nature of the slowdown. Because 𝛾0 captures a change in slope rather than a one- time level shift, this result implies that employment growth weakened on an ongoing, month-by-month basis after the policy intervention.
The pooled estimate of the instantaneous post-event level change, 𝛿0, is negative but estimated with greater uncertainty. The posterior mean of 𝛿0 is –1.435, with a posterior standard deviation of 2.58 and a 95 percent HDI of [–6.801, 3.711]. While approximately 74 percent of posterior mass lies below zero, the credible interval overlaps zero, indicating that the immediate level response at the time of Liberation 4 U.S. Bureau of Labor Statistics (2026), Employment Level - Foreign Born [LNU02073395] [data set], https://fred.stlouisfed.org/series/LNU02073395.
Day is less precisely identified than the subsequent change in trend. Taken together with the estimate of 𝛾0, this pattern suggests that the dominant effect of the policy operates through a sustained slowdown in employment growth rather than a sharp one-time drop in employment levels.
Turning to the population controls, the pooled coefficient on foreign-born population changes 𝜃𝑃𝑂𝑃𝐹𝑂𝑅𝐸𝐼𝐺𝑁𝐵𝑂𝑅𝑁,0 has a posterior mean of -0.295, a posterior standard deviation of 1.451, and a 95 percent HDI of [–3.312, 2.67], with approximately 29 percent of posterior mass above zero. This indicates no strong evidence of a systematic relationship between foreign-born population changes and employment growth at the pooled level once sector-specific trends are accounted for. Similarly, the pooled coefficient on native-born population changes 𝜃𝑃𝑂𝑃𝑁𝐴𝑇𝐼𝑉𝐸𝐵𝑂𝑅𝑁,0 is centered near zero, with a posterior mean of -3.158, a posterior standard deviation of 2.652, and a wide credible interval of [–9.07, 1.207], providing little evidence of a consistent association with employment outcomes.
The heterogeneity parameters reported in Table 1 reveal substantial cross-sector variation, particularly for the post-event slope change. In particular, the posterior mean of 𝜎𝛾is 10.018, with a 95 percent HDI of [5.855, 15.071], indicating meaningful dispersion in post–Liberation Day employment responses across industries. This finding underscores the importance of the hierarchical framework: while the pooled estimates summarize average effects, sectors differ substantially in the magnitude of their post-event slowdowns.
Taken together, the pooled posterior estimates in Table 1 present a coherent and internally consistent picture. Employment growth was positive on average prior to Liberation Day but experienced a statistically and economically meaningful deterioration thereafter. This deterioration is driven primarily by a persistent change in the trajectory of employment growth rather than a one-time level shift and remains robust after accounting for population dynamics. The next section examines sector-level posterior estimates to assess how this average pattern varies across industries and whether any sectors experienced materially different post-event dynamics.
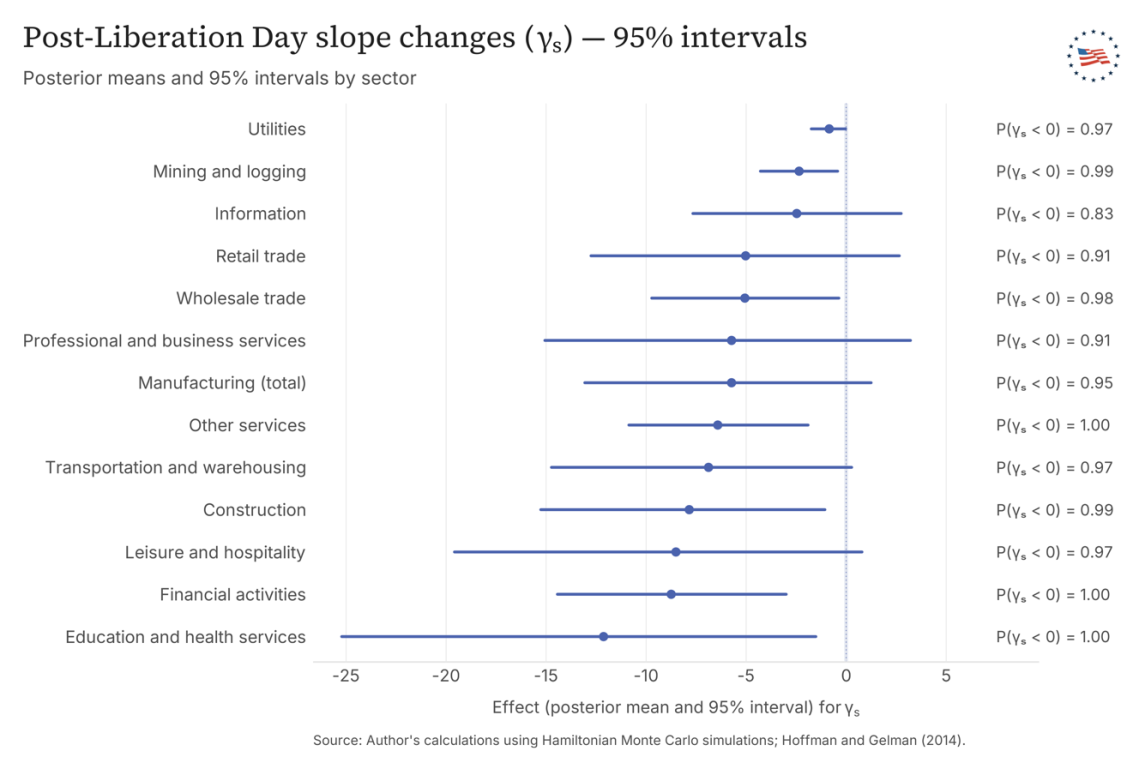
Sector-level forest plots, presented in Figures 9-11, reinforce this conclusion. Posterior means for the post-event slope changes (γₛ) are negative across all sectors, with posterior probabilities of negative effects exceeding 0.9 for all sectors except Information. Although individual sector 95% credible intervals often include zero, the consistent alignment of posterior mass below zero indicates a broad-based deceleration in employment growth following Liberation Day rather than isolated sector-specific effects.
Sector-level results are depicted in Figures 9-11: Figures 9–11 present sector-level forest plots summarizing posterior means and 95% highest-density intervals (HDIs) from the hierarchical Bayesian event-study model. Each panel corresponds to a distinct component of the piecewise-linear specification: the pre-event slope (𝛽𝑠), the instantaneous level shift at Liberation Day (𝛿𝑠), and the post-event change in slope (𝛾𝑠). For each parameter, the accompanying probability column reports the posterior probability that the parameter is negative, P(· < 0), providing a direct and interpretable summary of posterior sign certainty.


Pre-event slope estimates (𝛽𝑠) reveal substantial heterogeneity in employment dynamics across sectors prior to Liberation Day. Several large service-producing sectors exhibit strong positive pre-event momentum. Education and health services stands out with a large positive pre-event slope (posterior mean 𝛽𝑠≈ 80.599; P(𝛽𝑠< 0) ≈ 0.00), indicating robust employment growth prior to the policy intervention. Leisure and hospitality (posterior mean 𝛽𝑠 ≈ 27.708; P(𝛽𝑠 < 0) ≈ 0.00) and construction (posterior mean 𝛽𝑠 ≈ 14.625; P(𝛽𝑠< 0) ≈ 0.0) also display strong positive pre-event trends. Other services similarly shows positive momentum (posterior mean 𝛽𝑠≈ 9.419; P(𝛽𝑠< 0) ≈ 0.00). In contrast, several sectors exhibit weak or negative pre-event trends, including professional and business services (posterior mean 𝛽𝑠≈ −2.506; P(𝛽𝑠< 0) ≈ 0.7797), information (posterior mean 𝛽𝑠≈ −5.486; P(𝛽𝑠< 0) ≈ 0.99985), and manufacturing (posterior mean 𝛽𝑠≈ −4.2; P(𝛽𝑠< 0) ≈ 0.906). Retail trade is centered near zero (posterior mean 𝛽𝑠≈ −2.2; P(𝛽𝑠 < 0) ≈ 0.99), indicating little evidence of systematic pre-event growth or decline.
Estimates of the instantaneous level shift at Liberation Day (𝛿𝑠) are generally less precise than the slope parameters, with several sectors exhibiting wide HDIs that overlap zero. Nevertheless, some sectors display relatively concentrated posterior mass below zero, suggesting an immediate negative level effect at the time of the event. Wholesale trade shows a negative level shift (posterior mean 𝛿𝑠 ≈ −0.987; P(𝛿𝑠 < 0) ≈ 0.6544), as do construction (posterior mean 𝛿𝑠≈ −2.406; P(𝛿𝑠< 0) ≈ 0.99) and other services (𝛿𝑠≈ −2.688; P(𝛿𝑠< 0) ≈ 0.781054). By contrast, information (posterior mean 𝛿𝑠≈ -0.661; P(𝛿𝑠 < 0) ≈ 0.62945) and transportation and warehousing (posterior mean 𝛿𝑠≈ -1.986; P(𝛿𝑠< 0) ≈ 0.71355) do not exhibit consistent evidence of an immediate negative discontinuity. Overall, these results suggest that sharp one- time employment drops at the event date are not the dominant feature of post– Liberation Day employment dynamics.
The post-event slope change estimates (𝛾𝑠) provide the clearest evidence of a structural shift in employment growth following Liberation Day. For most sectors, 𝛾𝑠is negative with high posterior probability, indicating a broad-based deceleration in monthly employment growth. The largest negative slope changes are observed in education and health services (posterior mean 𝛾𝑠 ≈ −12.127; P(𝛾𝑠< 0) ≈ 0.99655), construction (posterior mean 𝛾𝑠≈ −7.844; P(𝛾𝑠< 0) ≈ 0.99), and leisure and hospitality (posterior mean 𝛾𝑠≈ −8.509; P(𝛾𝑠< 0) ≈ 0.9741). Trade- and supply-chain-related sectors also experience pronounced negative slope changes, including transportation and warehousing (posterior mean 𝛾𝑠 ≈ −6.88; P(𝛾𝑠 < 0) ≈ 1.00), wholesale trade (posterior mean 𝛾𝑠≈ −5.063; P(𝛾𝑠< 0) ≈ 0.9833), retail trade (posterior mean 𝛾𝑠≈ -5.025; P(𝛾𝑠< 0) ≈ 0.9147), and manufacturing (posterior mean 𝛾𝑠≈ −5.73; P(𝛾𝑠< 0) ≈ 0.9486). Two sectors stand out as partial exceptions: information has a slightly positive posterior mean with substantial uncertainty (𝛾𝑠≈ -2.47; P(𝛾𝑠< 0) ≈ 0.828), while utilities is close to zero in magnitude (posterior mean 𝛾𝑠≈ −0.847; P(𝛾𝑠< 0) ≈ 0.97325). Taken together, the 𝛾𝑠 estimates indicate that the primary post-event effect is a sustained weakening in employment growth rather than a transitory disturbance.
Taken together, the forest plots indicate that the post–Liberation Day period is characterized by a widespread deceleration in employment growth across sectors, driven primarily by persistent changes in growth rates rather than one-time employment shocks. While a small number of service sectors continue to add jobs, most sectors experience either sharply reduced growth or outright contraction, underscoring the breadth and durability of the post-event employment slowdown.
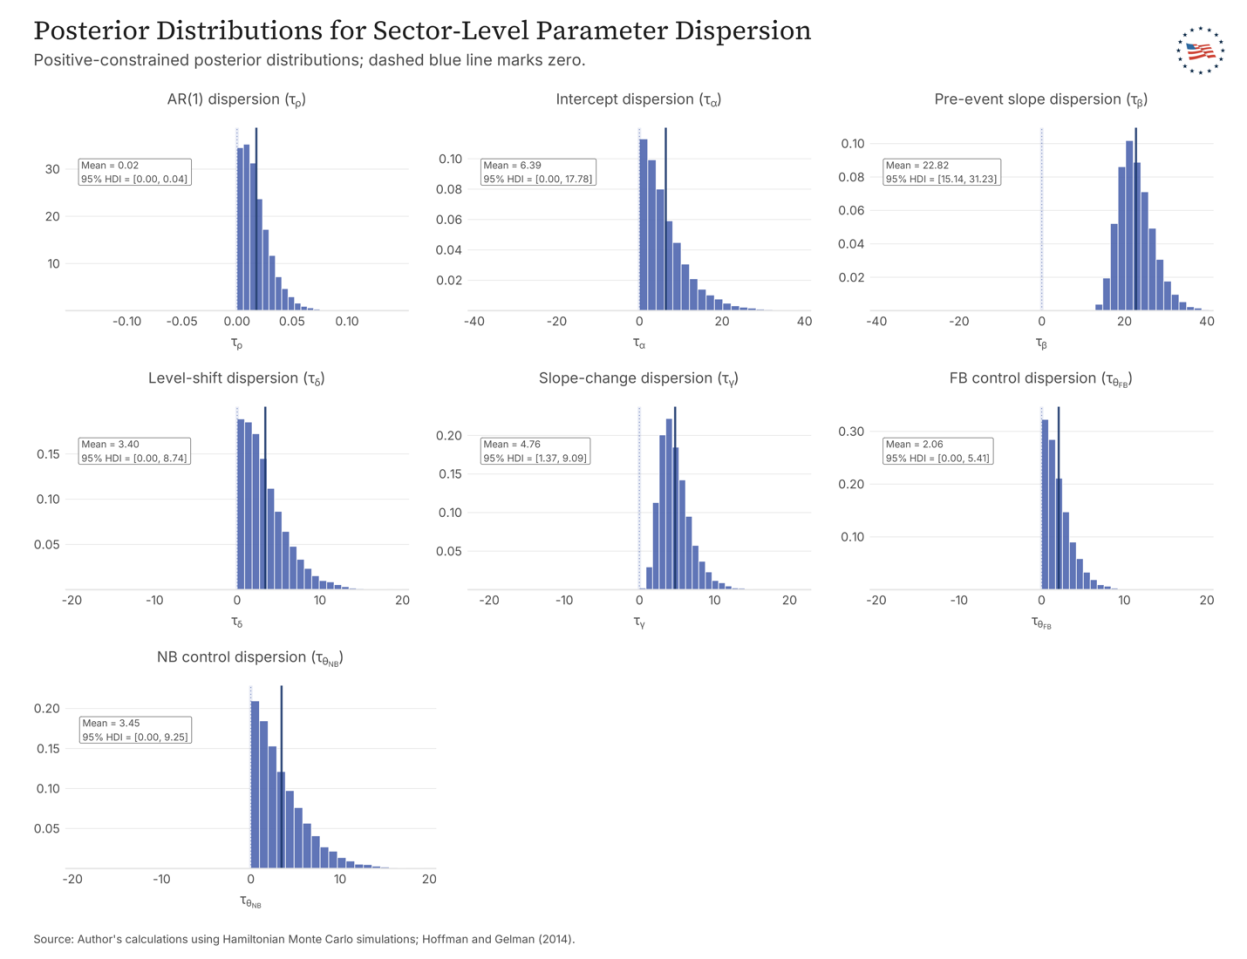
Diagnostics and Posterior Goodness of Fit Convergence and model adequacy were evaluated using a combination of standard Markov chain Monte Carlo diagnostics and posterior predictive checks. Taken together, these diagnostics indicate stable posterior sampling and an adequate fit for the purposes of inference, with only mild evidence of conservatism in the model’s variance structure.
Convergence was evaluated using Gelman–Rubin statistics (R̂ ), effective sample sizes (ESS), and Geweke diagnostics (Gelman & Rubin, 1992; Geweke, 1992). R̂ values are essentially equal to unity for all monitored parameters, indicating good mixing across chains. Effective sample sizes are large, with bulk ESS generally in the thousands to tens of thousands and tail ESS similarly high, implying low Monte Carlo error in posterior summaries. Geweke z-scores, which compare early and late segments of each chain, show that approximately 91 percent of parameters satisfy |z| ≤ 2 and roughly 98 percent satisfy |z| ≤ 3. The small number of larger z-scores are concentrated in a limited subset of pooled coefficients and one variance component, rather than being pervasive across the model. In the context of a hierarchical specification with an autoregressive error structure, this pattern is consistent with mild residual autocorrelation in a few directions rather than a lack of convergence.
Model fit was evaluated using a Bayesian chi-square posterior predictive check, which compares a discrepancy measure computed on the observed data to the same measure computed on replicated datasets drawn from the posterior predictive distribution. Rather than relying on a one-sided tail probability, we report a two-sided posterior predictive probability defined as 2 ∙min (𝑃(𝑇(ỹ) ≥𝑇(𝑦)|𝑦),1 − 𝑃(𝑇(ỹ) ≥𝑇(𝑦)|𝑦). Using 20,000 posterior draws, this two-sided posterior predictive probability equals 0.414. Posterior predictive values near 0.5 indicate close alignment between observed and replicated discrepancies, while smaller values indicate mild asymmetry under the chosen variance-sensitive discrepancy measure. To the extent that any deviation is present, it reflects slight overdispersion in the replicated data relative to the observed data, suggesting that the model is mildly conservative in its variance specification rather than misspecified in its central tendency.
This interpretation is consistent with additional posterior predictive diagnostics. Sector-level and aggregate posterior predictive checks show that the model reproduces the key features of the employment time series, including overall trends and cross-sector variation, while slightly overstating variability in some periods. Residual autocorrelation diagnostics likewise indicate that the AR(1) structure captures the dominant temporal dependence, with only limited remaining autocorrelation.
Importantly, inference in this setting is driven primarily by slope parameters rather than higher-order moments, further limiting the impact of modest variance discrepancies on the substantive conclusions.
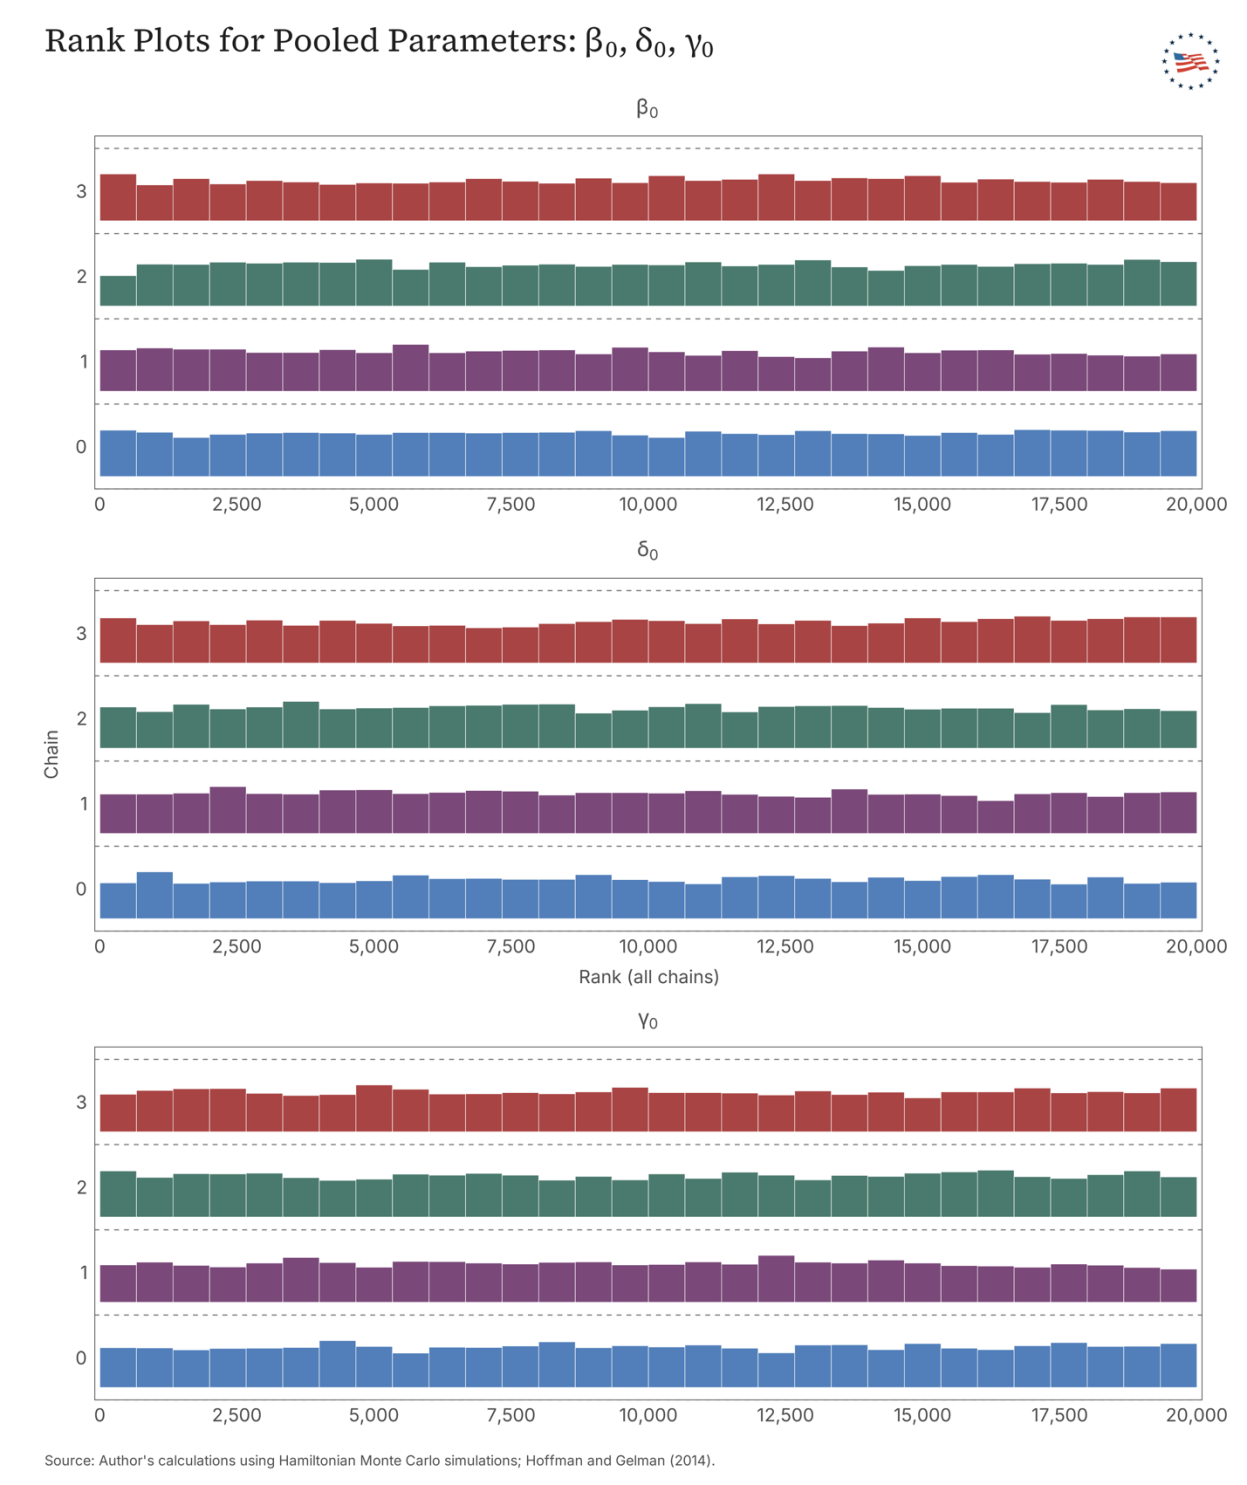
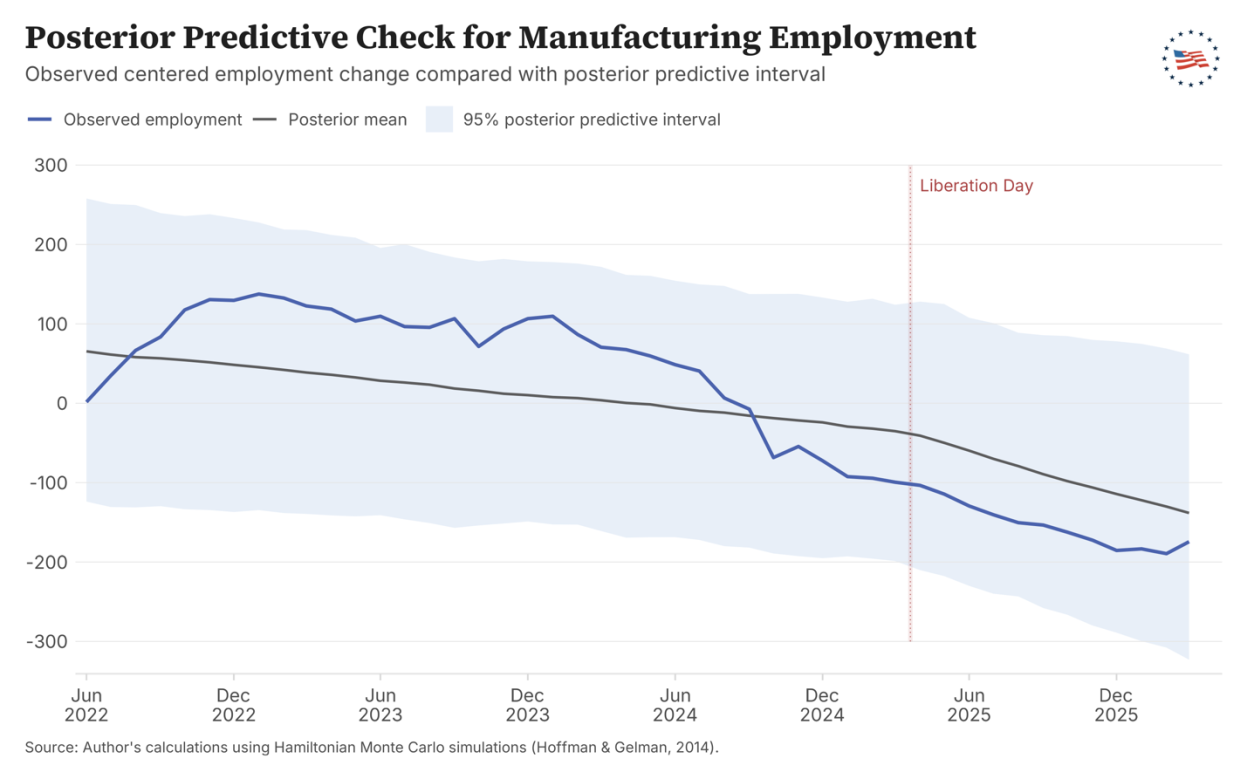
Additional diagnostic evidence is reported in Appendix Figures 18-20. Appendix Figures 18 and 19 present rank and trace plots for key pooled parameters, while Appendix Figure 20 reports an observed-versus-fitted posterior predictive check for the manufacturing sector. Taken together, these plots reinforce the conclusion that the chains mix well and that the model reproduces the central features of the employment series in a representative trade-exposed sector.
Overall, the diagnostic evidence supports the conclusion that the hierarchical Bayesian event-study model is well behaved and suitable for inference. The primary quantities of interest—particularly the pre-event trend and the post–Liberation Day change in slope—are precisely estimated, stable across chains, and robust to the modest variance conservatism observed in the posterior predictive checks. As such, the core findings are unlikely to be artifacts of convergence failure or model misspecification.
The empirical analysis presented in this paper documents employment trends in the period surrounding Liberation Day with methodological rigor. Our econometric approach allows us to isolate changes in employment dynamics coinciding with the tariff shock, relative to pre-existing trends or unrelated macroeconomic factors. We find no evidence that the Liberation Day tariffs produced any discernible benefit to American workers in the aggregate. The theoretical channels through which tariffs were supposed to create jobs (import substitution, domestic production expansion, manufacturing revival) did not materialize at detectable scale, while the channels through which tariffs harm employment (input cost increases, export market contraction, consumer spending reduction, capital misallocation) left signatures in the employment data that our analysis identifies and quantifies. The findings are consistent with the theoretical mechanisms described in the preceding section and with the historical record of previous tariff episodes.
This paper presents two complementary analyses: a descriptive examination of post-pandemic employment trends and a formal hierarchical Bayesian event study. Both arrive at the same conclusion about the post–Liberation Day period from different perspectives. The exploratory figures (Figures 6-7 and Appendix Figures 12-15) show something visually striking. Prior to Liberation Day, employment levels across most sectors were either rising or at least supported by generally positive monthly job changes. After Liberation Day, that pattern changed. Monthly job growth weakened sharply across much of the economy and, in several sectors, turned persistently negative. Over time, these weaker monthly flows translated into stagnating or declining employment levels. This pattern was especially clear in manufacturing and in trade- and supply-chain-related sectors, but it was also visible across many parts of the service economy.
The hierarchical Bayesian event-study model formalizes what the figures suggested. Rather than focusing on visualizing monthly changes, the model asks a deeper question: did the underlying direction of employment growth change after Liberation Day? The answer from the marginal posterior analysis is yes—and with very high certainty. Before Liberation Day, employment growth across sectors in the U.S. economy was generally positive. After Liberation Day, however, the model detects a broad and persistent deterioration in the slope of employment growth. This distinction is an important one. The policy did not simply coincide with a one- time drop in employment. Instead, the post–Liberation Day period is characterized by a sustained weakening in the rate at which jobs were being added each month. Even modest negative changes in monthly growth rates accumulate as time since Liberation Day increases into large employment shortfalls, meaning the economic consequences grow gradually the longer the post-event period persists.
This pattern is visible in the raw data and confirmed statistically by our event study analysis. The posterior probability that the post–Liberation Day change in employment growth is negative exceeds 99 percent at the pooled level, and sector- level results show remarkably consistent evidence of slower job growth across industries.
While broader macroeconomic factors, including post-pandemic normalization, monetary policy tightening, and global economic conditions, may have influenced employment dynamics over this period, the empirical strategy employed here mitigates these concerns. By comparing within-sector employment trends before and after the policy intervention, the model isolates deviations from established trajectories rather than relying on cross-sectional comparisons. As a result, the estimated post–Liberation Day slowdown reflects a break from prior sector-specific trends rather than a continuation of pre-existing macroeconomic forces.
Importantly, this deterioration cannot be attributed to demographic changes. The model explicitly accounts for month-to-month changes in both native-born and foreign-born populations within each sector. If short-run employment gains were primarily driven by shifts in the composition of the workforce, these variables would exhibit clear and systematic relationships with employment changes. They do not.
At the pooled level and across sectors, the posterior estimates for both demographic controls are centered near zero with wide credible intervals. This indicates that month-to-month changes in native-born and foreign-born populations have little measurable association with month-to-month employment changes once underlying sector trends are taken into account.
This finding is important because it directly challenges a common assumption in trade and immigration debates: that reducing the presence of foreign-born workers will mechanically translate into improved employment outcomes for native-born workers. The evidence here provides no support for that mechanism. Employment trajectories appear to be governed primarily by sectoral economic forces rather than by short-run demographic substitutions within the labor force.
In other words, the data suggest that employment growth is not a simple function of who is present in the labor market in a given month, but rather of the broader economic conditions that determine how many jobs firms are able to sustain.
Although some tariff apologists blame the hiring slowdown on artificial intelligence (“AI”) advances, the data tell a different story. As seen in Figure 12, sectors with low exposure to AI, especially construction and mining and logging, had similar credible declines in employment growth compared to sectors with more AI exposure. (Gimbel et al., 2026)The implications for manufacturing are particularly revealing. The stated purpose of Liberation Day was to revive domestic manufacturing employment. (The White House, 2025c; Trump, 2025) Yet both the descriptive figures and the model show that manufacturing employment, far from experiencing the promised renaissance, showed no positive employment effect credibly above zero following the Liberation Day tariffs. Manufacturing jobs declined. In fact, the sector experienced one of the clearer post-event slowdowns in monthly job growth. Importantly, this is not a visually subjective conclusion drawn from the charts. The hierarchical Bayesian model estimates that there is roughly a 95 percent probability that the post–Liberation Day change in manufacturing’s employment growth rate is negative. In practical terms, the data strongly indicate that monthly job growth in manufacturing weakened during the post-event period rather than improved, directly contradicting the policy’s stated objective.
More broadly, the evidence highlights how trade restrictions affect a highly interconnected economy. Industries most exposed to retaliatory tariffs (agriculture, aerospace, industrial machinery) showed the most pronounced employment softening. Industries dependent on imported inputs faced rising costs that reduced their ability to hire and expand. Employment slowdowns are observed not only in goods-producing industries but also in sectors such as transportation, retail trade, professional services, and information—areas that depend on supply chains, trade flows, and business activity across the entire economy.
Policies aimed at protecting a subset of industries can therefore generate widespread employment effects far beyond their intended targets.
Taken together, the data suggest a clear policy lesson. Trade barriers intended to promote job growth can weaken overall employment dynamics while failing to produce gains in the sectors they are meant to protect. The evidence indicates that Liberation Day did not reverse structural employment trends in manufacturing and instead coincided with a broad-based deceleration in job growth across the economy.
The Supreme Court's IEEPA ruling creates an opportunity and an obligation for Congress to reclaim its Article I, Section 8 power over tariffs. Legislation should clarify the limits of executive emergency authority in the trade context, establish clear procedural requirements for any future tariff actions taken under emergency statutes, and create an expedited mechanism for congressional review and disapproval of executive tariff orders. The administration’s unlawful pivot to Section 122 as an alternative legal basis for tariffs after IEEPA was struck down illustrates that piecemeal judicial correction is an insufficient substitute for clearer statutory limits, and enforcement mechanisms for those limits, on executive trade authority. Congress must assert its exclusive authority to levy taxes, including tariffs.
True reciprocity exists when foreign markets impose tariff or non-tariff barriers on U.S. exports equivalent to U.S. barriers on comparable goods. Unfortunately, the administration redefined the term, in an Orwellian sleight of hand, to mean an equal balance of trade (no trade deficit) between countries. True reciprocity would require the U.S. to lower tariffs overall to levels below those existing prior to Liberation Day. Where genuine reciprocity concerns exist, the appropriate response is negotiated tariff reduction, not unilateral escalation.
The NAFTA framework demonstrated that free trade with free peoples produces export growth, investment inflows, and broadly shared income gains. An updated trade liberalization agenda should be pursued through negotiation, followed by legislative enactment.
To the extent that any tariffs remain in place under the Section 122 framework (which is unlawful) or future legislative authorization, policymakers should prioritize the elimination of tariffs on intermediate goods: raw materials, components, and other inputs used in domestic manufacturing, such as capital goods. These tariffs harmed American manufacturers by raising input costs and disrupting supply chains. These firms responded by substituting lower-grade materials and reducing investment (Baker McKenzie, 2025). It is imperative to remember that all tariffs impose diffuse costs on all American workers and consumers to provide concentrated benefits to a subset of protected producers, with no guarantee that the protected jobs permanently survive. The aggregate costs far exceed the concentrated benefits.
Instead of championing the protectionism proven to retard prosperity, politicians should be enacting complementary domestic policies to ensure businesses and families can take full advantage of the opportunities generated from free trade.
Manufacturing especially is impacted by government policy. Federal regulatory compliance costs alone can easily exceed $50,000 annually per worker for small manufacturers (NAM News Room, 2023). For decades, manufacturing investment has migrated to states with right-to-work laws, lower business tax burdens, affordable industrial electricity, and a regulatory environment that does not impede permitting and construction. The federal government can enhance manufacturing by continuing to remove barriers to affordable energy, reducing the corporate tax burden on capital investment, and streamlining permitting for new industrial facilities.
The Liberation Day tariffs were the largest single-episode increase in effective U.S. tariff rates since the eve of the Great Depression. As a result, families and businesses are paying more for both imported and domestically produced goods. Economic growth declined, and foreign direct investment fell. Farm bankruptcies spiked as export markets shrank and machinery and fertilizer costs rose. Manufacturers dependent on imported components became less competitive globally. The unlawful tariffs triggered retaliatory barriers that harmed American exporters and frazzled supply chains.
The employment data analyzed in this paper are consistent with these outcomes in every dimension that economic theory would predict. Jobs growth stalled, with manufacturing jobs outright disappearing.
Altogether, this report finds no evidence that the Liberation Day tariffs succeeded in strengthening employment outcomes in the United States. Instead, the data point to a broad-based and persistent weakening of employment growth following the policy intervention, including in manufacturing—the sector that the policy was explicitly intended to revive (NDTV, 2025; The White House, 2025d). The estimated post-event slope changes indicate not a temporary disruption, but rather a sustained downward shift in employment trajectories. Moreover, the slowdown cannot be explained by demographic shifts or population dynamics. Furthermore, there is no evidence that the policy improved employment prospects for native-born workers. Taken together, the results suggest that trade restrictions imposed in the name of job creation risk undermining employment growth across the economy while failing to deliver their promised benefits.
Policymakers now face a clear choice between two paths for employment growth. This report shows that the “Liberation Day” path of protectionism erodes the gains of trade liberalization. The appropriate response to the genuine challenges facing American workers is a renewal and deepening of the trade liberalization strategy that produced our post-NAFTA prosperity documented.
The Supreme Court's ruling restores the constitutional framework within which tariff policy belongs. Tariffs are taxes. As such, imposition is subject to congressional deliberation and approval in accordance with the Article I taxing authority that the Founders assigned exclusively to the legislative branch for good reason.
American workers are best served not by walls that shield inefficient producers from competition, but by the freedom to compete and the freedom to choose. Price signals in free markets reflect genuine scarcity and comparative advantage. Gains from voluntary exchange (free trade) accrue broadly to consumers, workers, and investors alike. The evidence of this paper combined with three decades of post- NAFTA economic history shows open markets produce prosperity; tariffs yield stagnation.
Post-COVID recovery timing is identified using monthly employment series from the Federal Reserve Bank of St. Louis (FRED) and a level-based return-to-peak criterion with multi-month confirmation. For each series, the pre-COVID benchmark is defined as the maximum employment level observed through February 2020, which represents the final month prior to the pandemic-induced labor market shock. The COVID trough is identified as the minimum employment level observed from March 2020 onward. Recovery is defined as the first month following the trough in which employment returns to at least its pre-COVID peak level and remains at or above that level for k consecutive months, with k = 3 in the baseline specification. The recovery month is recorded as the start of the first such qualifying run. This confirmation requirement mitigates sensitivity to short-lived month-to-month fluctuations near the threshold and ensures that recovery reflects a sustained return to pre-pandemic employment levels rather than a transitory rebound. As a robustness check, alternative confirmation windows (e.g., k = 2 or k = 4) yield qualitatively similar recovery timing, indicating that the results are not driven by the specific choice of confirmation horizon.


Axios. (2025, April 3). Trump tariffs: Canada, China, EU trade war countermeasures. Axios. https://www.axios.com/2025/04/03/trump-tariffs-canada-china-eu-trade-war-countermeasures
Baker McKenzie. (2025, August). Impact of tariffs on manufacturing businesses. https://www.bakermckenzie.com/en/insight/publications/2025/08/impact-of-tariffs-on-manufacturing-businesses
Blei, D. M., Kucukelbir, A., & McAuliffe, J. D. (2017). Variational inference: A review for statisticians. Journal of the American Statistical Association, 112(518), 859–877.
Boak, J., et al. (2025, March 13). Trump says tariffs will bring back “stolen” wealth and companies—and higher ones will work even better—as trade war fears stoke business anxiety. Fortune. https://fortune.com/2025/03/13/trump-tariffs-stolen-wealth-companies-trade-war-fears-business-anxiety
Board of Governors of the Federal Reserve System. (n.d.-a), Industrial Production: Manufacturing (SIC) [IPMANSICS] [data set]. Federal Reserve Bank of St. Louis. Retrieved May 5, 2026, from https://fred.stlouisfed.org/series/IPMANSICS
Board of Governors of the Federal Reserve System. (n.d.-b). Market yield on U.S. Treasury securities at 30-year constant maturity, quoted on an investment basis [DGS30] [Data set]. Federal Reserve Bank of St. Louis. Retrieved May 5, 2026, from https://fred.stlouisfed.org/series/DGS30
Board of Governors of the Federal Reserve System. (n.d.-c). Rest of the world; foreign direct investment in U.S.; asset (current cost), transactions [ROWFDIQ027S] [Data set]. Federal Reserve Bank of St. Louis. Retrieved May 5, 2026, from https://fred.stlouisfed.org/series/ROWFDIQ027S
Brill, A., & Cheema, H. M. (2025). Understanding the effects of tariffs. American Enterprise Institute. https://www.aei.org/research-products/report/understanding-the-effects-of-tariffs/
Brookings Institution. (2026, March). Tariffs in 2025: Short-run impacts on the U.S. economy. https://www.brookings.edu/articles/tariffs-in-2025-short-run-impacts-on-the-us-economy/
CNBC. (2017, January 25). Trump’s point man on trade: “We envision a more Germany- style economy.” https://www.cnbc.com/2017/01/25/trumps-point-man-on-trade-we-envision-a-more-germany-style-economy.html
Council on Foreign Relations. (2025, October 17). U.S. trade and manufacturing: A conversation with Peter Navarro. https://www.cfr.org/event/us-trade-and-manufacturing-conversation-peter-navarro
Donovan, K. (2024, October 17). Defending Bannon, champions of America First economic plans: Navarro slams “traitorous” MSNBC. WarRoom. https://warroom.org/defending-bannon-champions-of-america-first- economic-plans-navarro-slams-traitorous-msnbc Federal Reserve Bank of St. Louis. Federal Reserve Economic Data (FRED) [Data portal]. Retrieved May 5, 2026, from https://fred.stlouisfed.org
Fortune. (2025, April 3). Smoot-Hawley Act, tariffs, and the Great Depression. https://fortune.com/2025/04/03/smoot-hawley-act-tariffs-great-depression-trump/
Gelman, A., & Rubin, D. B. (1992). Inference from iterative simulation using multiple sequences. Statistical Science, 7(4), 457–472.
Geweke, J. (1992). Evaluating the accuracy of sampling-based approaches to the calculation of posterior moments. In Bayesian Statistics 4 (pp. 169–193). Oxford University Press.
Gimbel, M., Kendall, J., & Kulsakdinun, R. (2026, February 19). Labor market AI exposure: What do we know? The Budget Lab at Yale. https://budgetlab.yale.edu/research/labor-market-ai-exposure-what-do-we-know
Goldsberry, J. (2025, March 30). Peter Navarro implores “trust in Trump” on tariffs bringing “prosperity and price stability.” Washington Examiner. https://www.washingtonexaminer.com/policy/economy/3363571/peter-navarro-trust-in-trump-tariffs-prosperity-price-stability/
Hoffman, M. D., & Gelman, A. (2014). The No-U-Turn Sampler: Adaptively setting path lengths in Hamiltonian Monte Carlo. Journal of Machine Learning Research, 15(1), 1593–1623.
Holland & Knight. (2026, February). Supreme Court strikes down IEEPA tariffs. https://www.hklaw.com/en/insights/publications/2026/02/supreme-court-strikes-down-ieepa-tariffs
Kelley Drye. (n.d.). China, Canada, EU impose retaliatory tariffs as reciprocal tariffs come into effect. Retrieved May 5, 2026, from https://www.kelleydrye.com/viewpoints/blogs/trade-and-manufacturing-monitor/china-canada-eu-impose-retaliatory-tariffs-as-reciprocal-tariffs-come-into-effect-2
Lawder, D. (2026, March 25). Trump’s tariffs had little impact on GDP in 2025, but raised revenue, academic paper finds. Reuters. https://www.reuters.com/business/trumps-tariffs-had-little-impact-gdp-2025-raised-revenue-academic-paper-finds-2026-03-26/
Michel, N. (2025, April 4). Free trade didn’t kill the middle class. Wall Street Journal. https://www.wsj.com/opinion/free-trade-didnt-kill-the-middle-class-data-manufacturing-protectionism-policy-22d20f83
NAM News Room. (2023, October 26). Regulations cost small manufacturers more than $50K per worker. National Association of Manufacturers. https://nam.org/regulations-cost-small-manufacturers-more-than-50k-per-worker-29244/
National Taxpayers Union. (n.d.). Liberation Day tariff timeline. Retrieved May 5, 2026, from https://www.ntu.org/publications/detail/liberation-day-tariff-timeline
NDTV. (2025, April 3). “A little tough love”: Top quotes from Donald Trump’s tariff talk. https://www.ndtv.com/world-news/a-little-tough-love-top-quotes-from-donald-trump-tariff-talk-8073946
Neal, R. M. (2011). MCMC using Hamiltonian dynamics. In Handbook of Markov Chain Monte Carlo (pp. 113–162). Chapman & Hall/CRC.
SCOTUSblog. (2026, February 20). Supreme Court strikes down tariffs. https://www.scotusblog.com/2026/02/supreme-court-strikes-down-tariffs/
Sullum, J. (2025, April 4). Trump’s longtime obsession with trade deficits suggests his tariffs won’t end soon. Reason. https://reason.com/2025/04/04/trumps-longtime-obsession-with-trade-deficits-suggests-his-tariffs-wont-end-soon/
Tariff Act of 1930, Pub. L. No. 71–361 (1930). https://www.govinfo.gov/app/details/SERIALSET-09235_00_00-002-0476-0000
The Budget Lab. (2026, March 9). State of U.S. tariffs: March 9, 2026. https://budgetlab.yale.edu/research/state-us-tariffs-march-9-2026
The White House. (2025a, April 3). My fellow Americans, this is Liberation Day. April 2, 2025… – President Donald J. Trump [Video]. https://www.whitehouse.gov/videos/my-fellow-americans-this-is-liberation-day-april-2-2025-president-donald-j-trump-%F0%9F%87%BA%F0%9F%87%B8%F0%9F%A6%85/
The White House. (2025b, April 2). Annex I – Liberation Day tariff schedule. https://www.whitehouse.gov/wp-content/uploads/2025/04/Annex-I.pdf
The White House. (2025c, March 4). President Trump is putting American workers first — and bringing back American manufacturing. https://www.whitehouse.gov/articles/2025/03/president-trump-is-putting-american-workers-first-and-bringing-back-american-manufacturing/
The White House. (2025d, April 2). President Trump’s bold trade action draws praise. https://www.whitehouse.gov/articles/2025/04/president-trumps-bold-trade-action-draws-praise/
Trade Act of 1974, Pub. L. No. 93–618 (1974). https://www.congress.gov/bill/93rd-congress/house-bill/10710/text
Trade Expansion Act of 1962, Pub. L. No. 87–794 (1962). https://www.congress.gov/bill/87th-congress/house-bill/11970/text
Trump, D. (2025, November 11). Make American Wealthy Again event [Speech transcript]. Rev. https://www.rev.com/transcripts/make-america-wealthy-again-event
U.S. Bureau of Economic Analysis. (n.d.-a). Current payments to the rest of the world: Imports of goods [A255RC1A027NBEA] [Data set]. Retrieved May 5, 2026, from https://fred.stlouisfed.org/series/A255RC1A027NBEA
U.S. Bureau of Economic Analysis. (n.d.-b). Federal government current tax receipts: Taxes on production and imports: Customs duties (B235RC1A027NBEA) [Data set]. Federal Reserve Bank of St. Louis. Retrieved May 5, 2026, from https://fred.stlouisfed.org/graph/?g=1VADE
U.S. Bureau of Economic Analysis. (n.d.-c). Imports of goods (implicit price deflator) [A255RD3A086NBEA] [Data set]. Federal Reserve Bank of St. Louis. Retrieved May 5, 2026, from https://fred.stlouisfed.org/series/A255RD3A086NBEA
U.S. Bureau of Economic Analysis. (n.d.-d) Imports of goods: Industrial supplies and materials [LA0000041Q027SBEA] [Data set]. Federal Reserve Bank of St. Louis. Retrieved May 5, 2026, from https://fred.stlouisfed.org/series/LA0000041Q027SBEA
U.S. Bureau of Economic Analysis. (n.d.-e). Real exports of goods [A253RX1Q020SBEA] [Data set]. Federal Reserve Bank of St. Louis. Retrieved May 5, 2026, from https://fred.stlouisfed.org/series/A253RX1Q020SBEA
U.S. Bureau of Economic Analysis. (n.d.-f). Real imports of goods: Industrial supplies and materials (chain-type quantity index) [IB0000043Q086SBEA] [Data set]. Federal Reserve Bank of St. Louis. Retrieved May 5, 2026, from https://fred.stlouisfed.org/series/IB0000043Q086SBEA
U.S. Bureau of Economic Analysis. (n.d.-g). Real gross domestic product [GDPC1] [Data set]. Federal Reserve Bank of St. Louis. Retrieved May 5, 2026, from https://fred.stlouisfed.org/series/GDPC1
U.S. Bureau of Labor Statistics. (n.d.-a), All Employees, Federal [CES9091000001] [Data set]. Federal Reserve Bank of St. Louis. Retrieved May 5, 2026, from https://fred.stlouisfed.org/series/CES9091000001
U.S. Bureau of Labor Statistics. (n.d.-b) All Employees, Total Private [USPRIV] [Data set]. Federal Reserve Bank of St. Louis. Retrieved May 5, 2026, from https://fred.stlouisfed.org/series/USPRIV
U.S. Bureau of Labor Statistics. (n.d.-c). Employment-population ratio — 25–54 yrs. [LNS12300060] [Data set]. Federal Reserve Bank of St. Louis. Retrieved May 5, 2026, from https://fred.stlouisfed.org/series/LNS12300060
U.S. Bureau of Labor Statistics (n.d.-d), Employed full time: Median usual weekly real earnings: Wage and salary workers: 16 years and over [LES125281600Q] [Data set]. Federal Reserve Bank of St. Louis. Retrieved May 5, 2026, from https://fred.stlouisfed.org/series/LES1252881600Q
U.S. Bureau of Labor Statistics. (n.d.-e). Employed, usually work full time [LNS12500000] [Data set]. Federal Reserve Bank of St. Louis. Retrieved May 5, 2026, from https://fred.stlouisfed.org/series/LNS12500000
U.S. Bureau of Labor Statistics. (n.d.-f). Labor force participation rate [CIVPART] [Data set]. Federal Reserve Bank of St. Louis. Retrieved May 5, 2026, from https://fred.stlouisfed.org/series/CIVPART
U.S. Bureau of Labor Statistics. (n.d.- g). (Employment Level - Foreign Born [LNU02073395] [data set], https://fred.stlouisfed.org/series/LNU02073395
U.S. Bureau of Labor Statistics. (n.d.-h). Employment level — native born [LNU02073413] [Data set]. Federal Reserve Bank of St. Louis. Retrieved May 5, 2026, from https://fred.stlouisfed.org/series/LNU02073413
U.S. Bureau of Labor Statistics. (n.d.-i). Current Employment Statistics (CES). Retrieved May 5, 2026, from https://www.bls.gov/ces/
U.S. Census Bureau. (n.d.-a). Real median family income in the United States [MEFAINUSA672N] [Data set]. Federal Reserve Bank of St. Louis. Retrieved May 5, 2026, from https://fred.stlouisfed.org/series/MEFAINUSA672N
U.S. Census Bureau. (n.d.-b). Total construction spending: Manufacturing in the United States [TLMFGCONS] [Data set]. Federal Reserve Bank of St. Louis. Retrieved May 5, 2026, from https://fred.stlouisfed.org/series/TLMFGCONS
Yahoo Finance. (n.d.). S&P 500 (^SPX) quote. Retrieved May 5, 2026, from https://finance.yahoo.com/quote/%5ESPX/
Yale Budget Lab. (n.d.). Where we stand: Fiscal, economic, and distributional effects of all U.S. tariffs enacted in 2025 through April. Retrieved May 5, 2026, from https://budgetlab.yale.edu/research/where-we-stand-fiscal-economic-and-distributional-effects-all-us-tariffs-enacted-2025-through-april
York, E., & Durante, A. (2026, March 13). Tracking the impact of the Trump tariffs & trade war. Tax Foundation. https://taxfoundation.org/research/all/federal/trump-tariffs-trade-war/