
Who Pays the Aluminum Tariff?
A Data-Driven Assessment of Section 232
EXECUTIVE SUMMARY
- The Section 232 aluminum tariff produced no domestic supply response. U.S. primary smelter output is essentially indistinguishable from its pre-tariff level.
- U.S. industrial buyers bear the cost with the Midwest premium over the London Metal Exchange cash price rising approximately fivefold, from about 20 cents per pound to nearly $1 per pound.
- The tariff shrank trade flows rather than redirecting them. Canadian shipments to the United States fell by roughly a third and U.S. crude aluminum exports collapsed by about two-thirds.
ABSTRACT
On February 10, 2025, the United States more than doubled the Section 232 tariff on imported aluminum from 10 percent to 25 percent and eliminated prior country exemptions. The rate was subsequently doubled again to 50 percent on June 4, 2025. This paper assesses the early effects of those measures using monthly U.S. Geological Survey production and trade data, country-level import flows, and the Midwest aluminum premium over the London Metal Exchange (LME) cash price. Across each of these series, a consistent pattern emerges. The tariff produced no domestic supply response: U.S. primary smelter output is essentially unchanged from its pre-tariff level. Additionally, the tariffs did not generate meaningful supplier substitution: Imports from Canada fell sharply while gains at alternative suppliers were small and, in the case of the United Arab Emirates, largely faded over the post-tariff window. What the tariffs did produce, however, was a sharp increase in domestic prices. The Midwest premium has risen nearly fivefold and closely tracked the statutory tariff rate once the rate was doubled to 50 percent in June. The cost has overwhelmingly fallen on Americans. Taken together, the early evidence indicates that the Section 232 aluminum tariff functions principally as a price increase on U.S. consumers rather than as a tool for rebuilding domestic primary aluminum production.
INTRODUCTION
The Section 232 aluminum tariff increases were issued on February 10, 2025. Taking effect on March 12, 2025, they raised the rate on imported aluminum to 25 percent and eliminated prior country exemptions; on June 4, 2025, the rate was doubled to 50 percent. (Proclamation 10895, 2025; Proclamation 10947, 2025) The stated rationale was to revitalize domestic aluminum production and reduce U.S. dependence on foreign metal. Ten months of post-tariff data now allow a reasonably clean assessment of whether the policy is achieving those goals and who is bearing its cost. This paper examines those questions using monthly U.S. Geological Survey production and trade data, country-level import flows, and the Midwest aluminum premium over the London Metal Exchange (LME) cash price.
HAS THE TARIFF REVIVED DOMESTIC PRODUCTION?
The most direct test of whether the tariff is rebuilding domestic aluminum capacity is whether U.S. primary smelters are producing more metal. Figure 1 plots monthly U.S. primary aluminum production from January 2023 through January 2026 using United States Geological Survey (USGS) data.
Figure 1
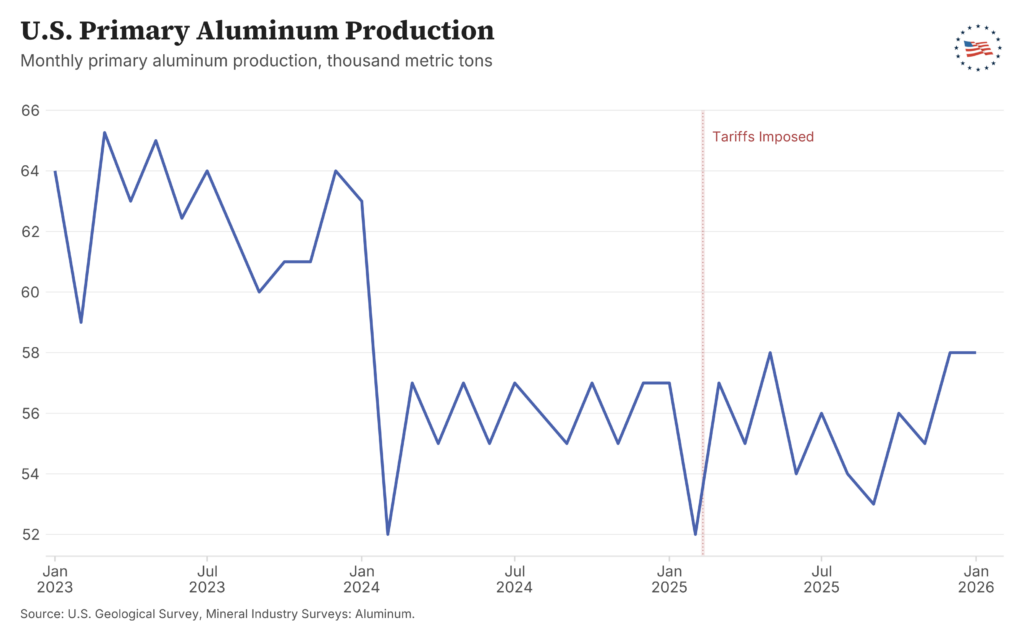
As Figure 1 illustrates, monthly output of U.S. primary smelters splits into two distinct regimes over the period from January 2023 through January 2026. Through 2023, U.S. production held at a plateau averaging roughly 62 thousand metric tons per month. In early 2024, it stepped down to about 55 thousand metric tons per month and has remained there since, with month-to-month variation in the 53 to 58 thousand metric ton range and two seasonal troughs near 52 thousand metric tons in February of each year.
Two features of this trajectory matter for evaluating the tariff. First, the step-down predates the tariff by a full year, occurring in early 2024, well before the January 20, 2025 marker, which means that whatever caused U.S. production to fall to its current level was a 2024 event, and not related to the tariff increases of 2025. Second, there is no inflection at the January 20, 2025 marker. Indeed, if the tariffs were intended to increase U.S. production, they failed to do so.
The stagnant nature of production after the imposition of the tariffs is the single clearest evidence that this tariff has failed to raise domestic production, with primary smelters operating at approximately 53 percent of installed capacity. New capacity is a 5–6 year, multi-billion-dollar investment that will be difficult for producers to commit to on a tariff-policy horizon. (Aluminum Association, n.d.; Aluminum Association, 2025; Fastmarkets, 2025; U.S. Geological Survey, 2026)
THE COLLAPSE IN U.S. CRUDE ALUMINUM EXPORTS
However, domestic production only tells part of the story. Aluminum trade flows respond to tariffs in both directions, and U.S. exports of crude metal — the unwrought form that primary smelters ship abroad — offer a complementary perspective of how the policy has reshaped the market. Figure 2 plots monthly U.S. exports of crude aluminum metals and alloys (HS 7601) over the same time horizon.
Figure 2
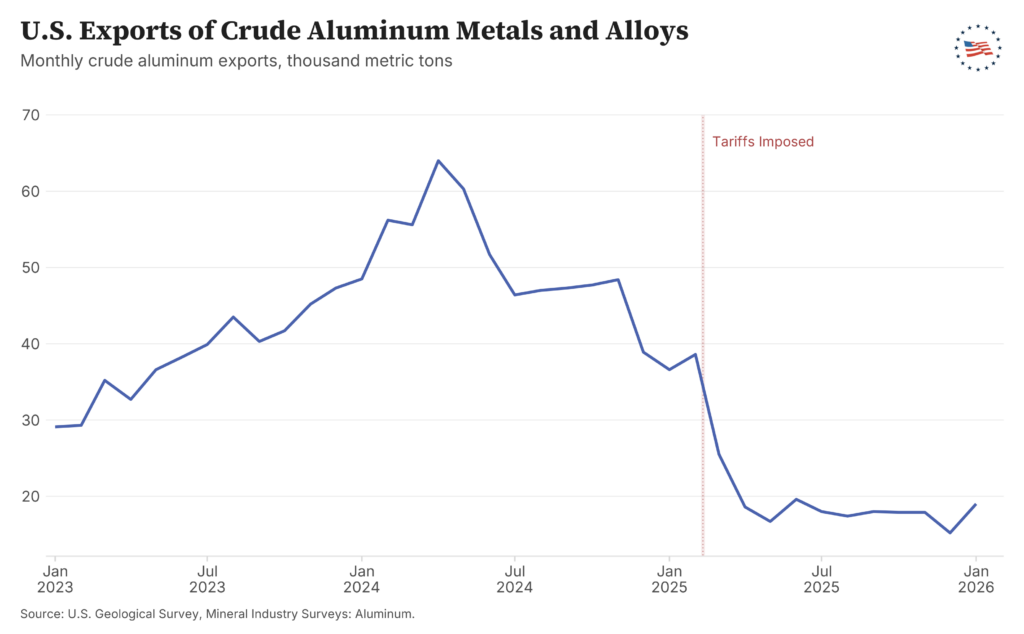
As Figure 2 illustrates, monthly U.S. exports of crude aluminum peaked at 64 thousand metric tons in April 2024, drifting down to about 41 thousand metric tons between the November 2024 election and January 2025, and then collapsed to approximately 18 thousand metric tons from April 2025 onward, holding flat at that low level for subsequent months. The reduction at the tariff onset is sharp, sudden, and sustained; the drop from roughly 38 thousand metric tons in February 2025 to about 18 thousand metric tons from April 2025 onward is a 53 percent reduction. Measured against the 2024 monthly average of roughly 51 thousand metric tons, the post-tariff floor of about 18 thousand metric tons represents a reduction of about two-thirds. Moreover, the post-tariff floor is remarkably flat, with no recovery attempt visible across the ten months of available data, indicating a structural rather than cyclical shift.
ALUMINUM IMPORTS AND THE FRONT-LOADING SPIKE
Clearly, domestic exports have collapsed since the imposition of tariffs; a question remains as to what happened on the import side. Figure 3 depicts the three components of U.S. aluminum imports for consumption — total imports, crude metals, and alloys (HS 7601, the primary tariff target), and semi-fabricated products (HS 7604–7616) — from January 2023 through January 2026.
Figure 3
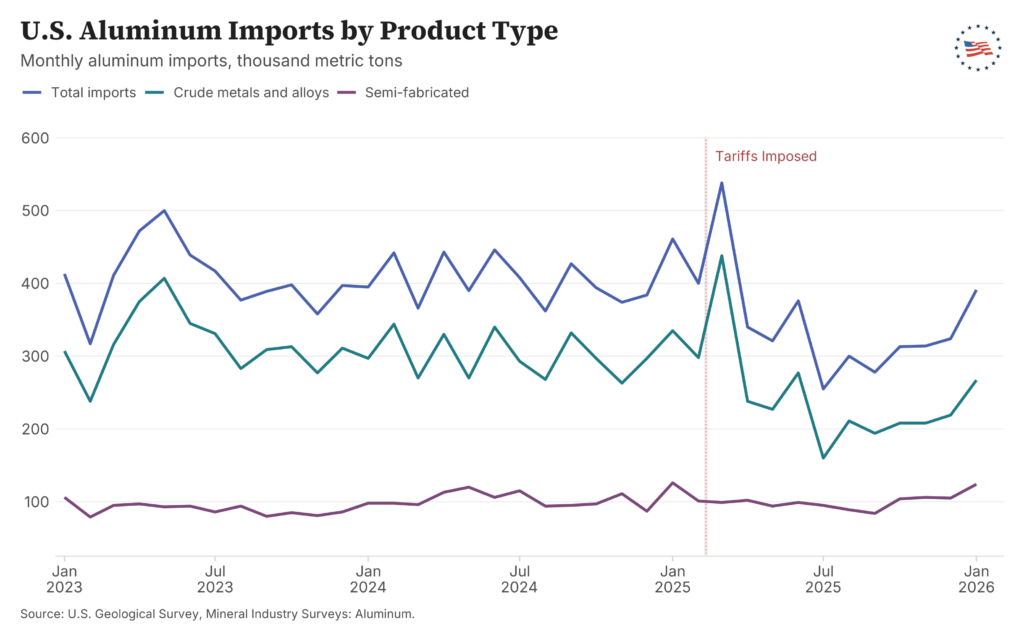
As Figure 3 illustrates, the three lines show total U.S. aluminum imports for consumption, imports of crude metals and alloys (HS 7601, the primary tariff target), and imports of semi-fabricated products (HS 7604–7616). The total line tracks closely with the crude line, since crude accounts for most of the volume, while semi-fabricated products run as a small and steady stream beneath.
The most striking feature is the March 2025 spike for all three series, where total imports surged from a baseline of roughly 400 thousand metric tons per month to 538 thousand metric tons in a single month before falling to about 340 thousand metric tons by April — a classic example of front-loading, with importers rushing shipments through customs to clear prior to the March 12 effective date.
As Figure 3 also illustrates, the post-tariff drop is carried entirely by crude metal imports, which fall from roughly 310 thousand metric tons per month to about 210 thousand metric tons and stay there, while the semi-fabricated line is essentially unchanged across the entire period. From April 2025 through January 2026, total imports hold steady at approximately 320 thousand metric tons per month, with neither recovery nor further deterioration visible across the ten months of available data.
WHO BEARS THE TARIFF? EVIDENCE FROM THE MIDWEST PREMIUM
The Midwest premium is the spread between the U.S. Midwest transaction price for delivered Grade A primary aluminum and the LME cash price. (S&P Global, n.d.-a; S&P Global, n.d.-b) Economically, the Midwest premium is a manifestation of logistics, financing, regional supply-and-demand conditions, and any tariff or duty cost. As a result, it is instructive to analyze changes in the premium to assess the impact of tariffs. Figure 4 offers a visual representation of the Midwest aluminum premium over the LME cash price, expressed in cents per pound — the extra amount a U.S. industrial buyer pays above the world benchmark.
Figure 4
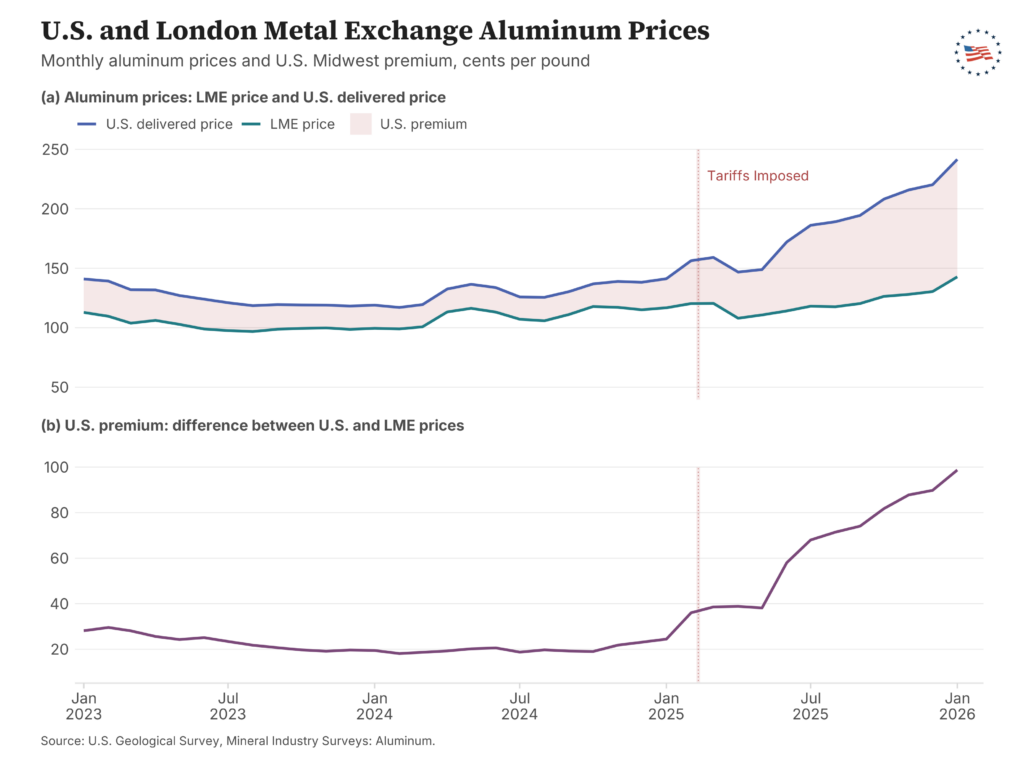
As Figure 4 illustrates, LME prices and Midwest prices diverged significantly after the imposition of the tariffs. In particular, the premium drifted from about 28 cents per pound in early 2023 down to a stable range near 20 cents per pound through 2024, ticked up modestly in late 2024 and early 2025, stepped to about 38 cents per pound from February through May 2025, and then accelerated from June onward to reach 99 cents per pound by January 2026 — a nearly fivefold increase from the pre-tariff baseline, among the largest moves in the history of this series.
The increase has a clear two-stage structure. The first leg, from February through May 2025, lifts the premium to roughly the level that a 25 percent pass-through of the tariff onto the LME price would imply on its own. The second leg, from June onward, coincides with the June 4, 2025 doubling of the Section 232 rate from 25 percent to 50 percent, which provides a direct mechanical explanation for much of the further increase rather than requiring a behavioral or structural one.
Treating the tariff as a markup on the pre-tariff U.S. delivered price of roughly $1.30 per pound in 2024, the 25 percent rate predicts a Midwest price of $1.63 per pound and the 50 percent rate predicts $1.95 per pound. Actual prices averaged $1.52 per pound from March through May 2025 — about 10 cents per pound below the 25 percent prediction, consistent with partial absorption by importers or working down of pre-tariff inventory — and $1.94 per pound from June through November 2025, within one cent of the 50 percent prediction. In January 2026, the Midwest aluminum price peaked at approximately $2.41, almost 50 cents per pound above the average prediction — a gap that partly stems from modest upward movement in the LME cash price itself and is small relative to the underlying tariff cost of $0.65 per pound. Thus, this pass-through analysis accounts for a significant component of the increase.
TRADE DIVERSION OR TRADE DESTRUCTION? COUNTRY-LEVEL EVIDENCE
The aggregate import series in Figure 3 shows how much aluminum is entering the United States, but not where it comes from. Decomposing imports by country of origin allows a direct test of whether the tariff has shifted U.S. demand from one set of suppliers to another. Figure 5 decomposes U.S. aluminum imports by country of origin in a stacked-area chart, showing each major supplier’s contribution to the total import volume over the analysis window.
Figure 5
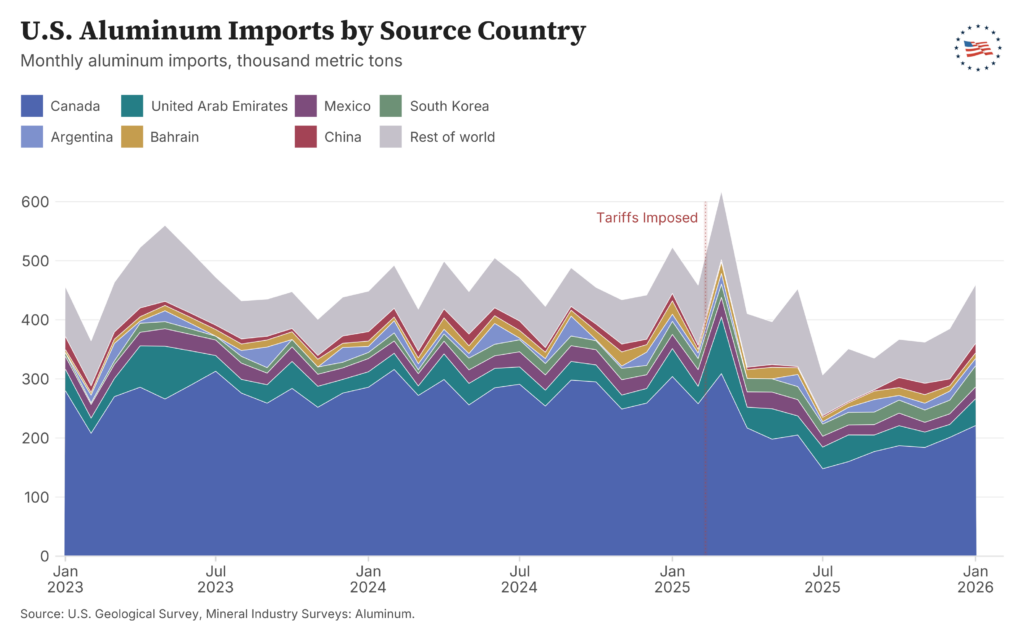
As Figure 5 illustrates, the total stack height equals total imports, with each colored layer representing each country’s contribution. Canada is the dominant supplier throughout, generally accounting for 50 to 65 percent of the stack, followed by the United Arab Emirates, a long tail of mid-sized suppliers including Mexico, South Korea, Argentina, China, and an aggregated “Rest of World” category.
The most conspicuous change in the chart is that the post-tariff stack is shorter, not just rearranged: Comparing the post-tariff window (April 2025 through January 2026) with the pre-tariff baseline (January 2023 through February 2025), the total falls by roughly 80 thousand metric tons per month, from about 462 to 382 thousand metric tons.1 The Canadian slab thins from approximately 276 thousand metric tons per month to about 190 thousand metric tons — a drop of about 86 thousand metric tons that accounts for approximately 90 percent of the entire decline. Other suppliers’ layers shift modestly and unevenly: South Korea added about 10 thousand metric tons per month and holds that gain through January 2026, while China saw a reduction of about 3 thousand metric tons per month, and the United Arab Emirates and Bahrain saw essentially no change. Furthermore, as the chart illustrates, multiple countries front-loaded in March 2025: Total imports spiked to roughly 619 thousand metric tons that month, with UAE shipments nearly tripling from 35 (averaged from January 2023 through February 2025) to 96 thousand metric tons, suggesting that exporters across the import base rushed shipments simultaneously to clear customs before the March 12 effective date.
Lastly, while Figure 5 traces the time series, Figure 6 summarizes the country-level changes as a horizontal bar chart showing the twelve countries with the largest absolute change, comparing average monthly imports during the post-tariff period (April 2025 through January 2026) to a pre-tariff baseline (January 2023 through February 2025), with March 2025 excluded as the front-loading spike.
Figure 6
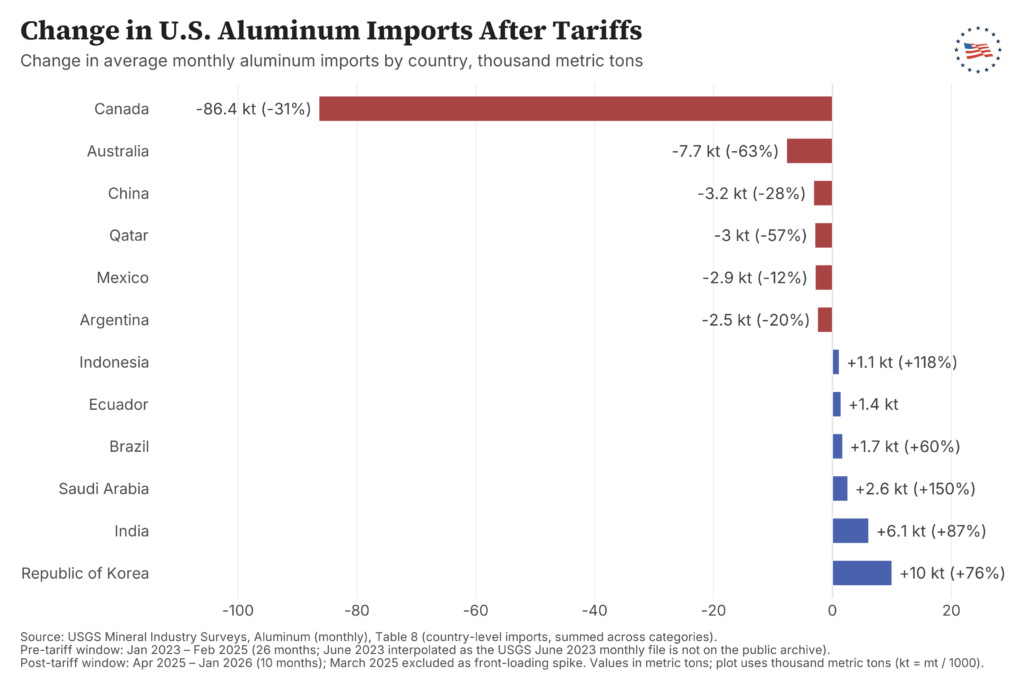
Red bars in Figure 6 show countries shipping less to the U.S., green bars show countries shipping more, and each bar is annotated with absolute change in thousand metric tons and percent change. The visual asymmetry is the point: Canada’s bar, at approximately −86.4 thousand metric tons per month, is over 10 times the next-largest negative bar — Australia at −7.7 thousand metric tons, and China at −3.2 thousand metric tons.
Net displacement is small. The sum of green bars is roughly 23 thousand metric tons per month against red bars summing to roughly −105 thousand metric tons, leaving about 82 thousand metric tons of net negative volume per month.
CONCLUSION
The Section 232 aluminum tariff notably raised the domestic price of aluminum, materially reduced import volume from Canada, and significantly reduced apparent U.S. consumption — indicating a stark decline in the output of U.S. manufacturers that use aluminum as an input, without inducing a domestic supply response. The Midwest premium — the spread U.S. industrial buyers pay above the world price — rose by roughly the full tariff amount, meaning foreign exporters absorbed essentially none of it. The wedge falls on the U.S. side of the border, paid in the first instance by industrial buyers as elevated input costs that they either absorb as compressed margins or pass to downstream consumers.
Either way, Americans pay the cost of the tariff. The intended beneficiaries — domestic primary smelters — gain pricing power but not market share, while Canadian producers and U.S. exporters bear the volume cost and American aluminum-using manufacturers and their workers bear the cost of more expensive inputs. Most fundamentally, this quantitative analysis suggests the policy is unlikely to revive U.S. primary aluminum production on any reasonable horizon while imposing real costs on U.S. industrial buyers.
REFERENCES
Aluminum Association. (n.d.). Energy powers aluminum production. Retrieved May 5, 2026, from https://www.aluminum.org/policy-agenda/energy (Accessed May 5, 2026).
Aluminum Association. (2025, May). Powering up American aluminum: A roadmap for next generation supply chain resilience [White paper]. https://www.aluminum.org/sites/default/files/2025-05/PoweringUpAluminum_WhitePaper_2025.pdf (Accessed May 5, 2026).
Fastmarkets. (2025, October 21). U.S. primary aluminum growth a “function of energy.” https://www.fastmarkets.com/insights/us-aluminium-smelting-and-energy-costs-3-key-growth-factors/ (Accessed May 5, 2026).
Proclamation 10895. (2025, February 18). Adjusting imports of aluminum into the United States. Federal Register, 90(31), 9807–9816. https://www.govinfo.gov/content/pkg/FR-2025-02-18/pdf/2025-02832.pdf (Accessed May 5, 2026).
Proclamation 10947. (2025, June 9). Adjusting imports of aluminum and steel into the United States. Federal Register. https://www.federalregister.gov/documents/2025/06/09/2025-10524/adjusting-imports-of-aluminum-and-steel-into-the-united-states (Accessed May 5, 2026).
S&P Global. (n.d.-a). Aluminum Midwest premium explained. Retrieved May 5, 2026, from https://www.spglobal.com/en/aluminum-midwest-premium-explained (Accessed May 5, 2026).
S&P Global. (n.d.-b). Platts U.S. aluminum transaction. Retrieved May 5, 2026, from https://www.spglobal.com/commodityinsights/en/our-methodology/price-assessments/metals/us-aluminum-transaction (Accessed May 5, 2026).
U.S. Geological Survey. (2026, February). Aluminum: Mineral commodity summaries 2026. https://pubs.usgs.gov/periodicals/mcs2026/mcs2026-aluminum.pdf (Accessed May 5, 2026).
APPENDIX
This Appendix documents the data and associated sources used to populate Figures 1–6 of the accompanying paper.
Data from monthly U.S. Geological Survey Mineral Industry Surveys (Aluminum) provided production, trade, country-level import, and price data for January 2023 through January 2026; the Midwest premium series uses the Platts U.S. aluminum transaction price (S&P Global) as cited in USGS Table 6. The 2024 and 2025–2026 monthly files were retrieved from the USGS Aluminum Statistics and Information index page, while the eleven 2023 backfill files (no longer listed on the USGS index) were retrieved directly from their stable URLs in the USGS S3 bucket. The June 2023 monthly file is not publicly available at any tested URL; for per-file series (country-level imports and exports), June 2023 values are linearly interpolated between the May and July 2023 figures, while year-to-date series (production, total imports, prices) carry actual June 2023 values from the prior-year section of the January 2024 file and are not interpolated.
References for data:
S&P Global. (n.d.). U.S. aluminum transaction price explained. Retrieved May 5, 2026, from https://www.spglobal.com/energy/en/pricing-benchmarks/assessments/metals/us-aluminum-transaction-price-explained
U.S. Geological Survey, National Minerals Information Center. (n.d.). Aluminum statistics and information. Retrieved May 5, 2026, from https://www.usgs.gov/centers/national-minerals-information-center/aluminum-statistics-and-information
U.S. Geological Survey, National Minerals Information Center. (2023). Aluminum in January 2023 [Mineral Industry Surveys monthly file]. https://d9-wret.s3.us-west-2.amazonaws.com/assets/palladium/production/s3fs-public/media/files/mis-202301-alumi.xlsx
U.S. Geological Survey, National Minerals Information Center. (2023). Aluminum in February 2023 [Mineral Industry Surveys monthly file]. https://d9-wret.s3.us-west-2.amazonaws.com/assets/palladium/production/s3fs-public/media/files/mis-202302-alumi.xlsx
U.S. Geological Survey, National Minerals Information Center. (2023). Aluminum in March 2023 [Mineral Industry Surveys monthly file]. https://d9-wret.s3.us-west-2.amazonaws.com/assets/palladium/production/s3fs-public/media/files/mis-202303-alumi.xlsx
U.S. Geological Survey, National Minerals Information Center. (2023). Aluminum in April 2023 [Mineral Industry Surveys monthly file]. https://d9-wret.s3.us-west-2.amazonaws.com/assets/palladium/production/s3fs-public/media/files/mis-202304-alumi.xlsx
U.S. Geological Survey, National Minerals Information Center. (2023). Aluminum in May 2023 [Mineral Industry Surveys monthly file]. https://d9-wret.s3.us-west-2.amazonaws.com/assets/palladium/production/s3fs-public/media/files/mis-202305-alumi.xlsx
U.S. Geological Survey, National Minerals Information Center. (2023). Aluminum in July 2023 [Mineral Industry Surveys monthly file]. https://d9-wret.s3.us-west-2.amazonaws.com/assets/palladium/production/s3fs-public/media/files/mis-202307-alumi.xlsx
U.S. Geological Survey, National Minerals Information Center. (2023). Aluminum in August 2023 [Mineral Industry Surveys monthly file]. https://d9-wret.s3.us-west-2.amazonaws.com/assets/palladium/production/s3fs-public/media/files/mis-202308-alumi.xlsx
U.S. Geological Survey, National Minerals Information Center. (2023). Aluminum in September 2023 [Mineral Industry Surveys monthly file]. https://d9-wret.s3.us-west-2.amazonaws.com/assets/palladium/production/s3fs-public/media/files/mis-202309-alumi.xlsx
U.S. Geological Survey, National Minerals Information Center. (2023). Aluminum in October 2023 [Mineral Industry Surveys monthly file]. https://d9-wret.s3.us-west-2.amazonaws.com/assets/palladium/production/s3fs-public/media/files/mis-202310-alumi.xlsx
U.S. Geological Survey, National Minerals Information Center. (2023). Aluminum in November 2023 [Mineral Industry Surveys monthly file]. https://d9-wret.s3.us-west-2.amazonaws.com/assets/palladium/production/s3fs-public/media/files/mis-202311-alumi.xlsx
U.S. Geological Survey, National Minerals Information Center. (2023). Aluminum in December 2023 [Mineral Industry Surveys monthly file]. https://d9-wret.s3.us-west-2.amazonaws.com/assets/palladium/production/s3fs-public/media/files/mis-202312-alumi.xlsx